
Overview#
When a user cannot connect to their Cloud PC, it is easy to assume the problem is their internet connection and often times it is. But sometimes it may be something else entirely. In this article, I will walk through the tools available in the Windows App, Web App, Intune and even the Microsoft Graph API to help narrow down the cause.
My goal is to keep this article updated as Microsoft improves these tools. At times, screenshots may look different.Rather than a step-by-step guide, this article is a reference to the tools and diagnostic options available for troubleshooting Cloud PC issues. Use the sections most relevant to your situation.
Use Windows App When Possible#
Before getting into troubleshooting, my recommendation is to use Windows App for Windows instead of the web client whenever possible. The browser remains useful for quick access and comparison testing, but it does not support all the networking features available in the installed app.
Two important examples are RDP Shortpath and RDP Multipath. They serve different purposes, but work together to improve session performance and reliability.
RDP Shortpath: Improve the Connection#
A Cloud PC session initially establishes a TCP-based connection through a gateway. RDP Shortpath adds a UDP-based transport between the local device and the Cloud PC, either directly or through a Microsoft relay when a direct connection is not possible.
Using UDP can reduce latency, improve responsiveness, and make better use of available bandwidth. In practice, that can mean a smoother remote desktop experience, particularly when network conditions are less than ideal. The actual benefit depends on the network path and conditions.
Shortpath is enabled by default for Windows 365 public-network connectivity, but the required UDP traffic and endpoints must still be allowed. Installing Windows App alone does not guarantee that the session will use it.
RDP Multipath: Keep the Session Connected#
RDP Multipath maintains multiple transport paths between Windows App and the Cloud PC. It monitors those paths and can transition traffic to an alternative if the active path degrades or becomes unavailable.
The main benefit is resiliency, not combining connections to multiply your bandwidth. An alternative path can help keep a session running through a temporary transport failure instead of interrupting the user.
Microsoft recommends Windows App for Windows version 2.0.1069.0 or later, with RDP Shortpath configured as the primary transport, for the best Multipath experience:
- Version 2.0.559.0 or later: Supports multiple UDP transport paths.
- Version 2.0.1069.0 or later: Adds redundant TCP transport paths, including resiliency when UDP is unavailable or restricted.
Why This Matters for Troubleshooting#
The web client supports neither RDP Shortpath nor RDP Multipath (at the time of writing this). A successful browser connection is therefore a useful comparison, but it does not test the same transport capabilities as Windows App.
For slow sessions or intermittent disconnections, check the Windows App version and the session’s Connection information to verify the transport in use and whether Multipath is enabled.
For more information, see Microsoft’s documentation on RDP Shortpath, RDP Multipath, and the Windows App feature comparison.
Before You Begin#
Before running an inspection, restarting a Cloud PC, or changing network settings, capture the original failure. Troubleshooting actions can change the device state and make an intermittent issue harder to investigate.
Record:
- What happens: Does the connection fail before the desktop appears, disconnect during use, or remain connected but respond slowly? Capture the exact error message and code.
- When it happens: Record the timestamp and time zone so you can locate the corresponding events in client logs and Intune reports.
- Who is affected: Is this one user, one Cloud PC, or several users sharing a location or network?
- What differs: Where practical, compare Windows App with the browser or test another approved network. Change one variable at a time and record the result.
Check Network Access#
Internet access is necessary, but it does not guarantee that a user can connect to their Cloud PC. Both the local device and the Cloud PC need access to the required service endpoints.
I would separate this into two checks:
- Local device network: Can the user’s device reach the authentication and remote connectivity endpoints? Are a VPN, proxy, firewall, or secure web gateway affecting the connection?
- Cloud PC network: Can the Cloud PC reach the services it needs? Are local security software, routing changes, or network controls interfering?
For deployments using an Azure Network Connection (ANC), also review the Azure virtual network controls. With a Microsoft-hosted network, Microsoft manages the underlying networking, but software and network configuration on the Cloud PC can still affect connectivity.
Microsoft maintains the Windows 365 network requirements and the required Azure Virtual Desktop endpoints for end-user devices.
Traffic interception, TLS/SSL decryption, and deep packet inspection can also interfere with required connectivity. Have your network team review the applicable Microsoft guidance and configure approved exceptions where required.
Network Best Practices for RDP#
Reaching the required endpoints is only part of the picture. The route that traffic takes to those endpoints also matters. Microsoft describes RDP as similar to Teams media traffic: real-time, latency-sensitive, and high-volume. A connection can pass basic reachability checks and still perform poorly if it takes an unnecessarily long or unstable path.
Microsoft’s Optimization of RDP traffic guidance focuses on three changes at both ends of the connection:
| Best practice | On the user’s local device | On the Cloud PC |
|---|---|---|
| Bypass the tunnel (Proxy, VPN, SWG) | Configure exceptions so the required RDP traffic does not travel through a proxy, VPN, or Secure Web Gateway (SWG) tunnel. | Bypass VPN or SWG agents. Provide a direct route using UDRs in AND deployments. |
| Egress locally | Break out nearest the user so the closest gateway and TURN relay are chosen. | Egress straight onto Microsoft’s network for ANC. A NAT Gateway is recommended. Nothing required for MHN. |
| Do not inspect RDP traffic | Do not inspect RDP at the egress firewall. It’s already encrypted end-to-end. | ANC*: UDR the WindowsVirtualDesktop tag to the internet. Keep RDP off your NVAs. |
These changes can reduce latency and jitter, avoid tunnel-related disconnects, and reduce the processing load on inspection devices. They complement Shortpath and Multipath rather than replacing their network requirements.
For Azure Network Connection (ANC) deployments, Microsoft recommends a user-defined route (UDR) targeting the WindowsVirtualDesktop service tag with Internet as the next hop, ideally with a NAT Gateway associated with the subnet. In this context, the Internet next hop does not mean that traffic to Microsoft’s RDP gateways and relays must leave Microsoft’s backbone. Other traffic can continue through your normal firewall or inspection path.
For Microsoft-hosted network deployments, you do not need to configure that underlying Azure routing yourself. However, a VPN or SWG agent installed inside the Cloud PC can still redirect traffic, so its bypass configuration remains important.
Scope these exceptions to the RDP flows documented by Microsoft, not all traffic or every Windows 365-related endpoint. RDP remains encrypted, and authentication, Conditional Access, device compliance, and endpoint protection still apply. Microsoft Entra authentication traffic is separate and may require TLS inspection for tenant restrictions. Have your network and security teams review the current endpoint and port requirements for your cloud environment.
One symptom worth watching for is a disconnect immediately after sign-in. A user-based VPN or SWG tunnel can start as the user signs in to the Cloud PC and change the route of an already-established RDP connection, forcing a reconnect. Check bypass rules for both user-based and machine-based tunnels, because the Cloud PC also needs connectivity before the user signs in.
Windows App in a Web Browser#
You can access Windows App at windows.cloud.microsoft. After signing in, you should see the Cloud PCs available to your account.
There are two places to gather information: the Cloud PC card before connecting, and the session toolbar after connecting.
Inspect Connection#
On the Cloud PC card, select the ellipsis (…) menu, then select Inspect connection. Review the confirmation and start the inspection.
The inspection will:
- Check that the Cloud PC is ready to connect.
- Check that the appropriate service is working properly.
- Try to resolve any issues that are detected.
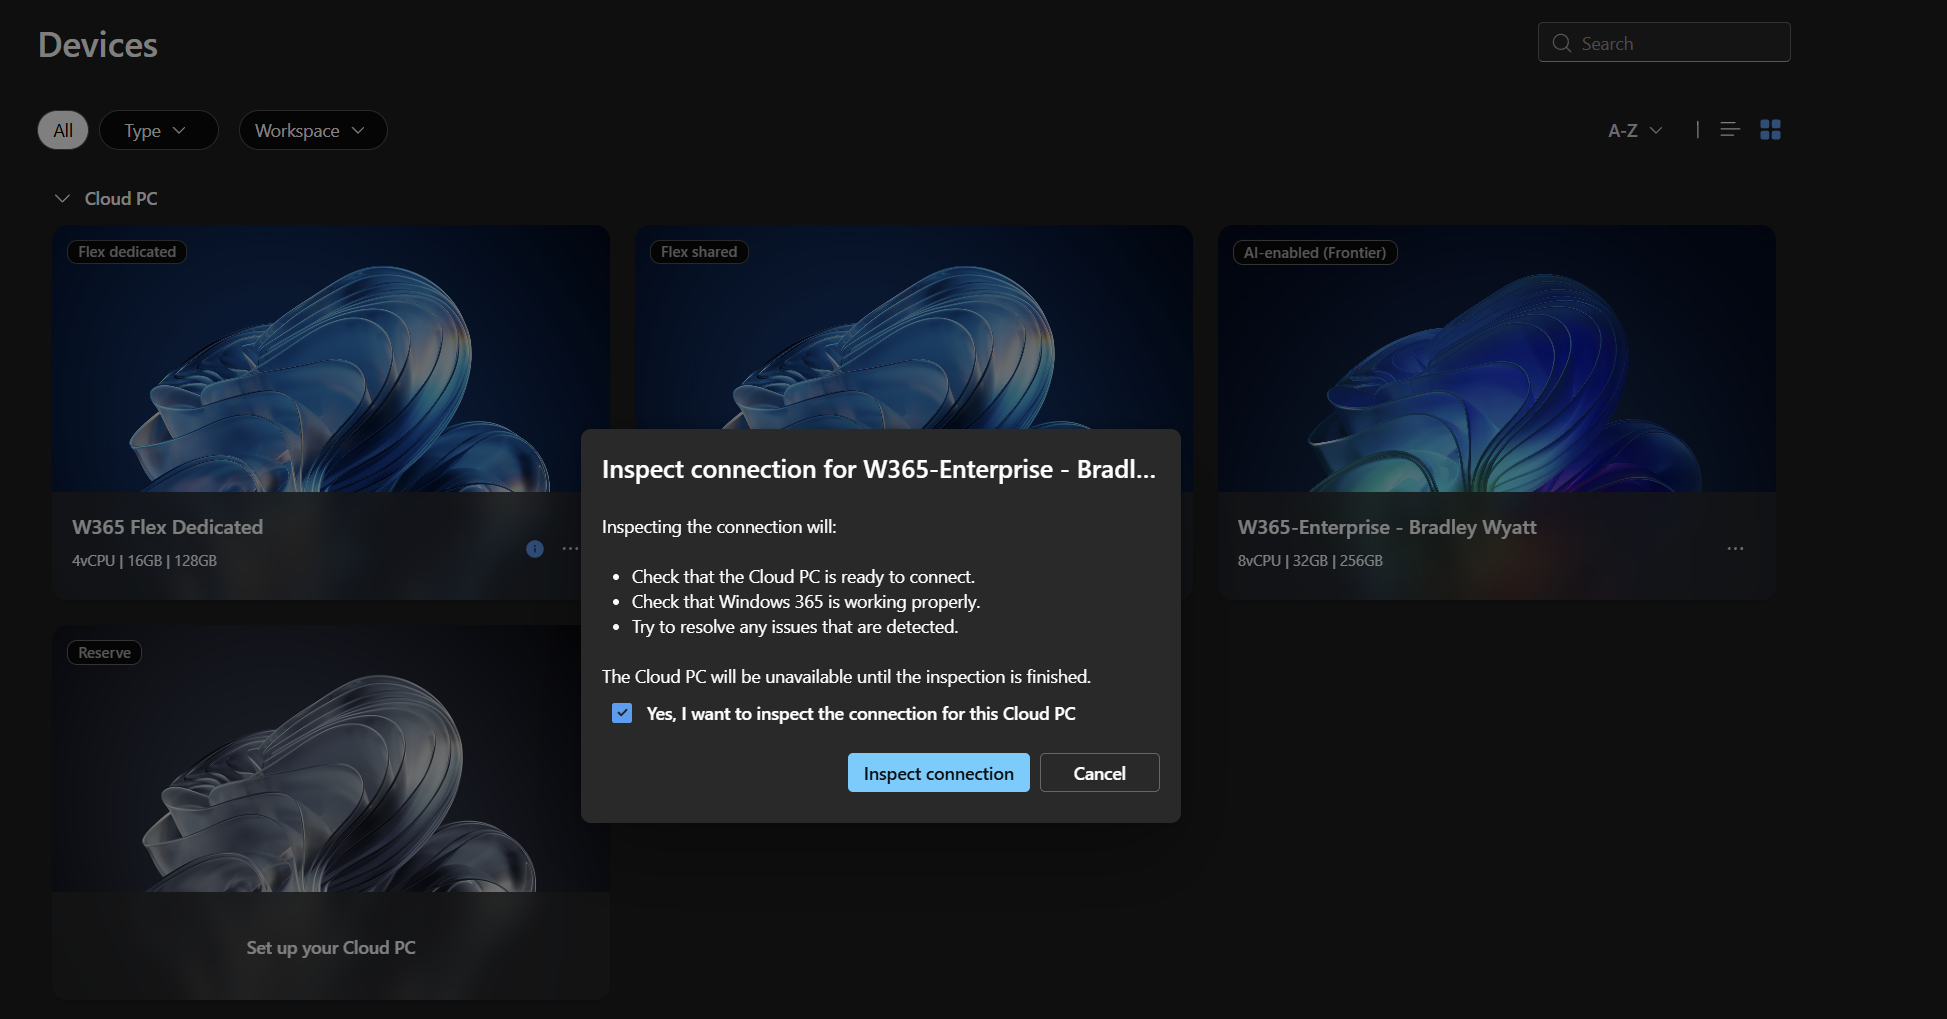
While the inspection is running, the Cloud PC will be uanavailable and the inspection can take several minutes.
Microsoft lists this action for Windows 365 Enterprise and Windows 365 Flex in Dedicated mode, not Flex in Shared mode. If the option is disabled, check the Cloud PC’s current state, including whether it is powered off, rather than assuming a network failure.
You may also see this functionality referred to as Troubleshoot in other interfaces or documentation.
Capture Logs When a Connection Fails#
If a connection attempt fails and the page offers Capture logs, download the log before closing the page.
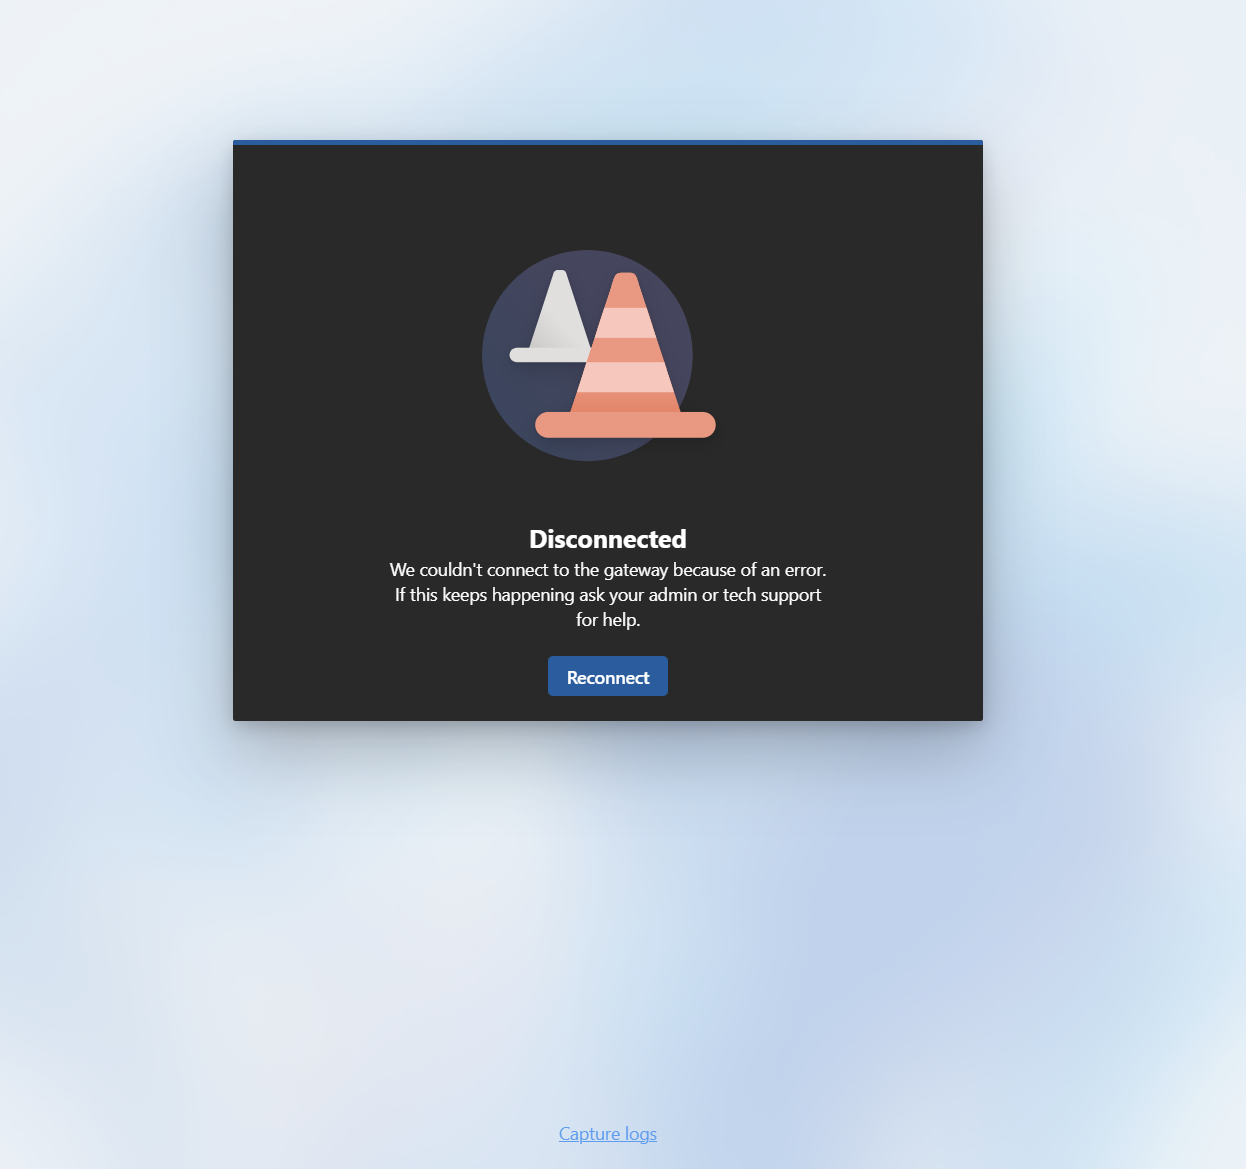
The browser will download the file using its normal download behavior. Depending on the user’s browser settings, it may save the file automatically or ask where to save it.
Depending on the failure and client version, the log can include:
- Browser, operating system, and client version information.
- Authentication flow details and account or tenant identifiers.
- Connection attempts, state changes, errors, and status codes.
- Gateway connection or fallback attempts.
- Connection configuration and diagnostic telemetry.
- Feature rollout settings, sometimes called flighting.
View Connection Information During a Session#
If the user can connect, ask them to gather connection information while the problem is occurring.
- Open the session toolbar.
- Select Connection information.
- Record the displayed client and network details.
- If available, select Download report to save the additional information.
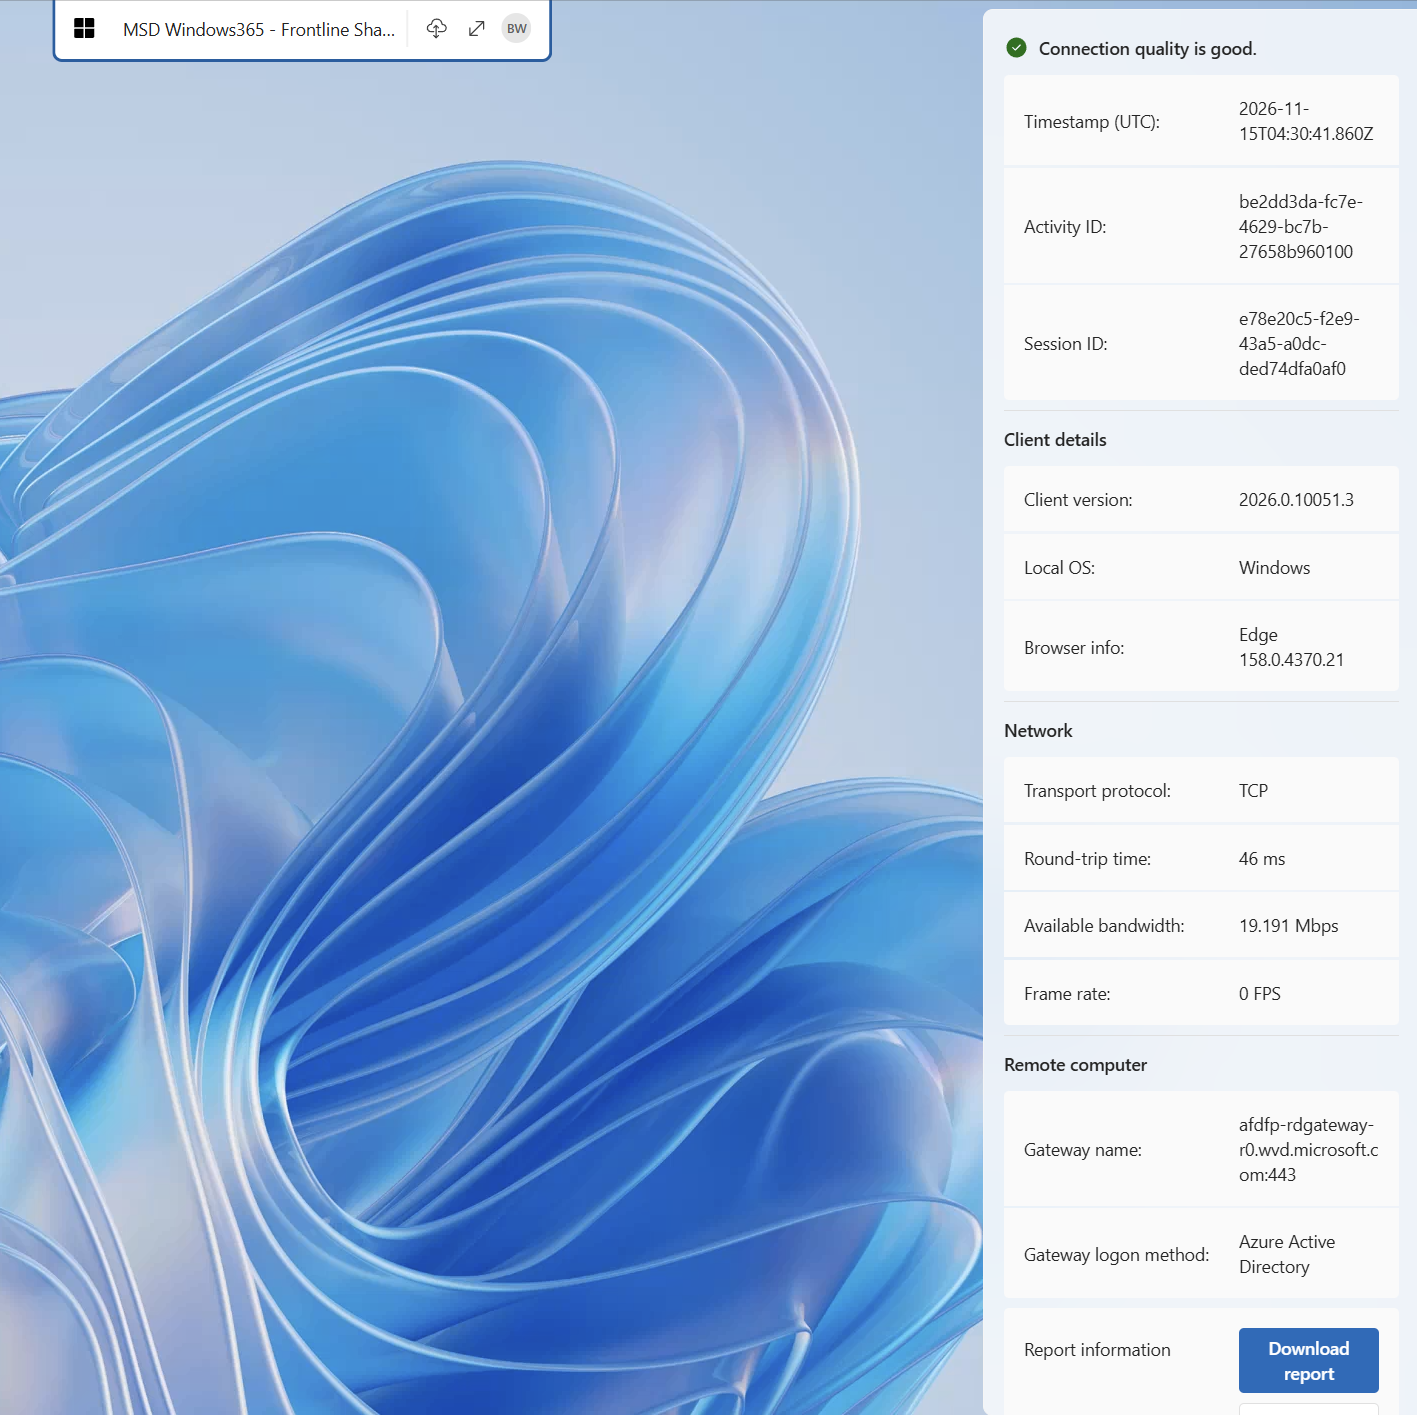
The interface shown here includes client and browser details, protocol, round-trip time, bandwidth, and frame rate. The report can also include user settings and feature rollout settings.
These metrics are more useful when you capture them during the reported problem and compare them with a normal session. A single bandwidth or frame-rate reading does not establish the cause of poor performance, and low frame rate during an idle session is not necessarily a problem.
Capture Logs During a Session#
The user does not need to wait for a failed connection to collect logs.
In the interface shown below, open About from the session toolbar, then select Capture logs. Microsoft’s log collection instructions describe opening the toolbar’s information icon and selecting Capture logs.
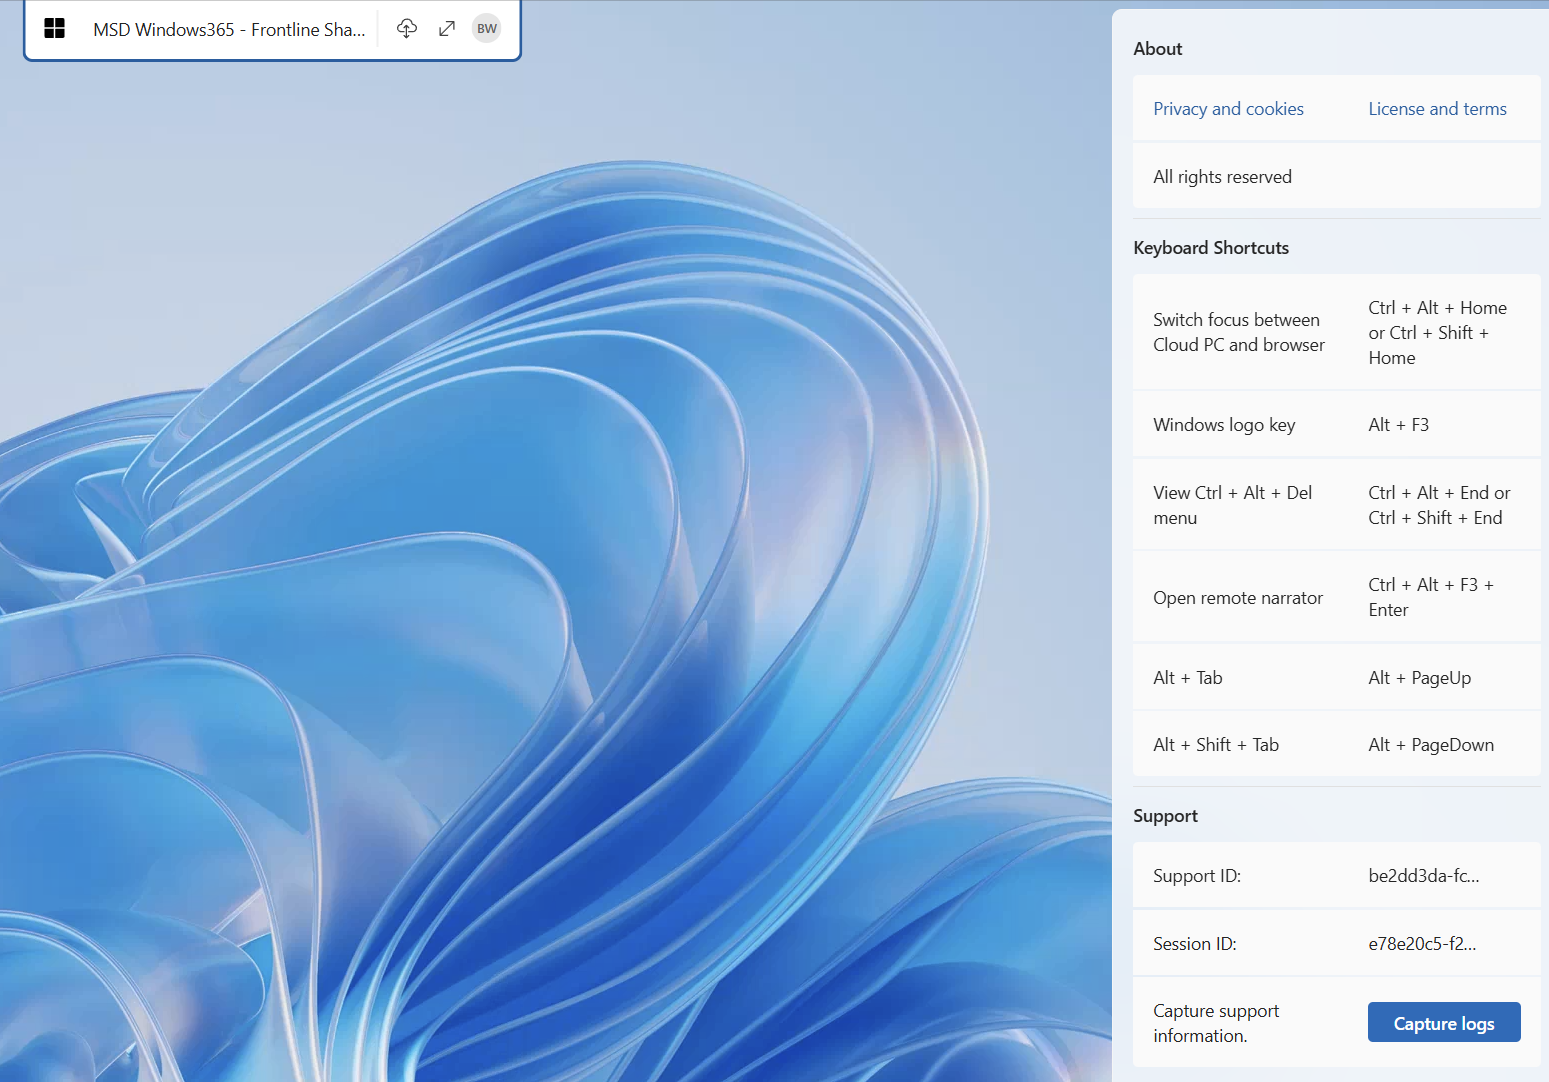
When possible, reproduce the issue before downloading the log. Include the approximate reproduction time when sharing it with support.
Windows App for Windows or MacOS#
Windows App provides connection inspection, local health checks, and diagnostic logs. These tools help distinguish a problem on the user’s device from one affecting the Cloud PC or service.
Inspect Connection#
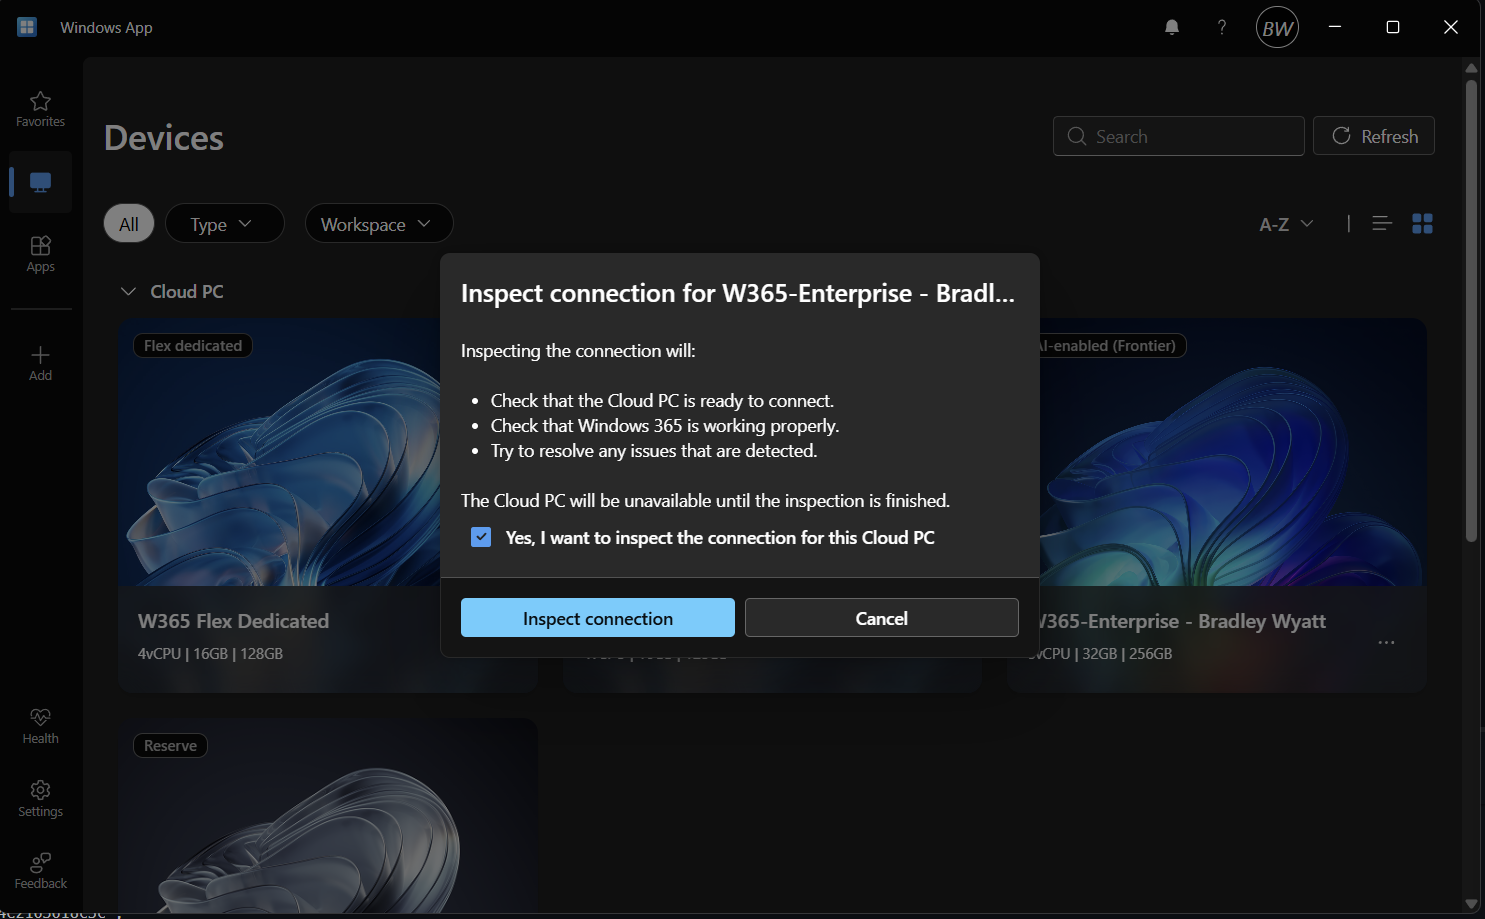
On the Devices page, select the ellipsis (…) menu on the Cloud PC card, then select Inspect connection.
The purpose and availability are the same as the browser action described above. Review the confirmation before starting, and remember that the Cloud PC will be unavailable for connections during the inspection.
In the interface shown here, Windows App displays progress and provides a notification when the inspection finishes. Review the result from the notification bell.
Review Health Checks#
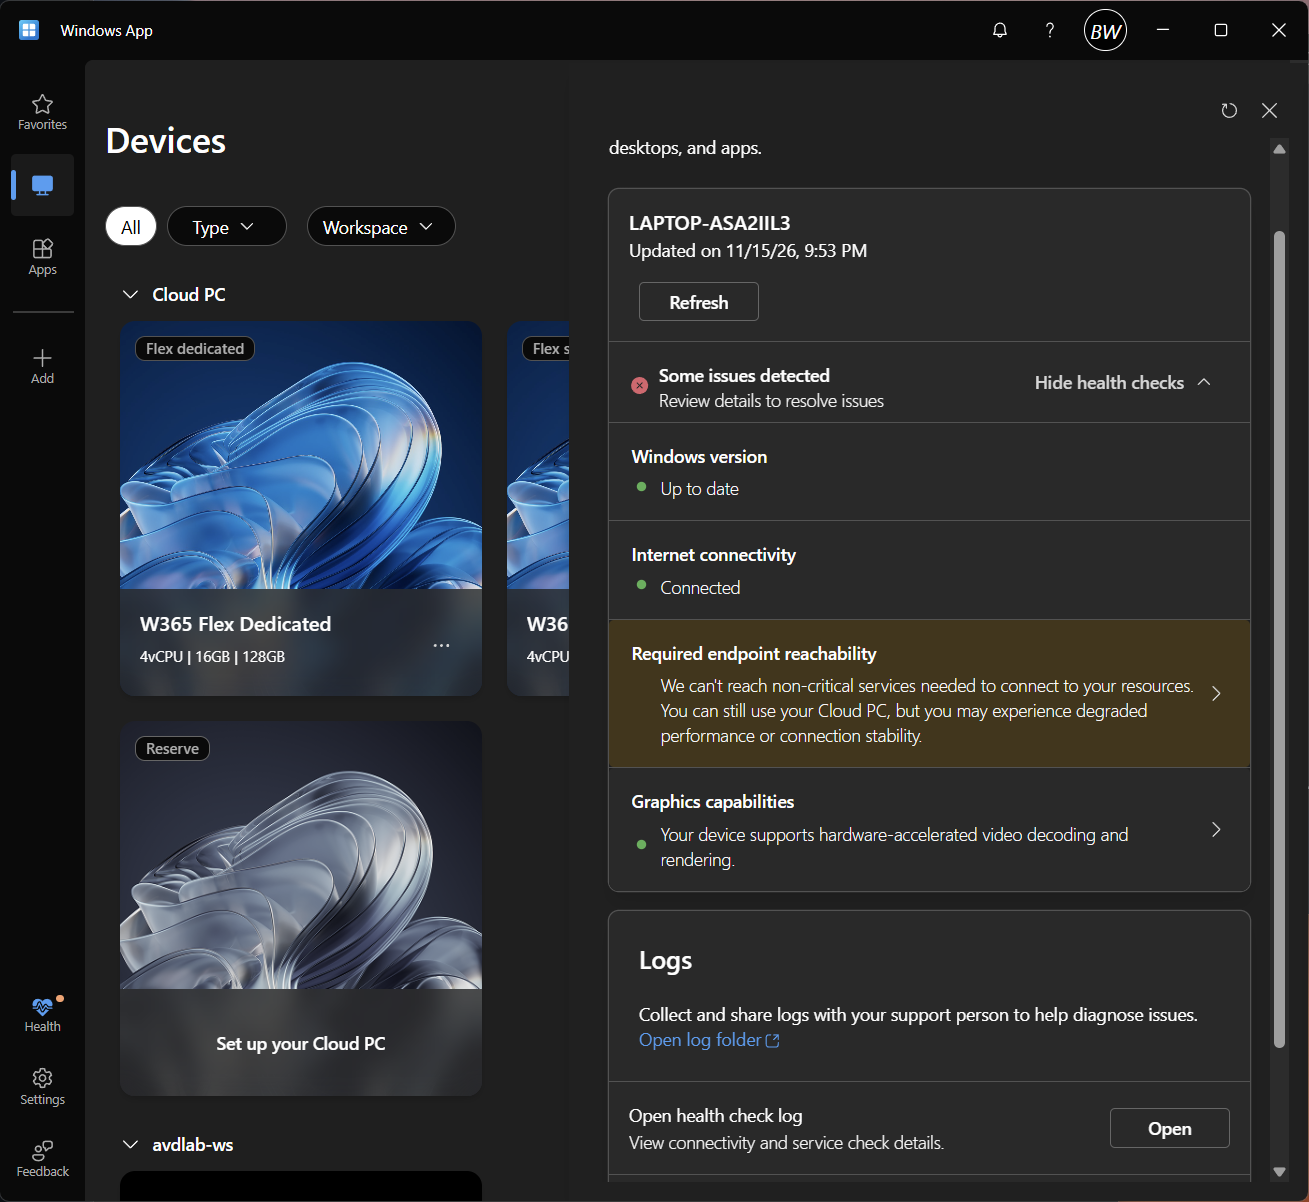
Select Health in the left navigation pane. Expand See all health checks to review individual results, then select Check again when you need to rerun them.
Microsoft documents Windows health checks as requiring Windows App version 2.0.703.0 or later. Check the current health check prerequisites if the option is missing.
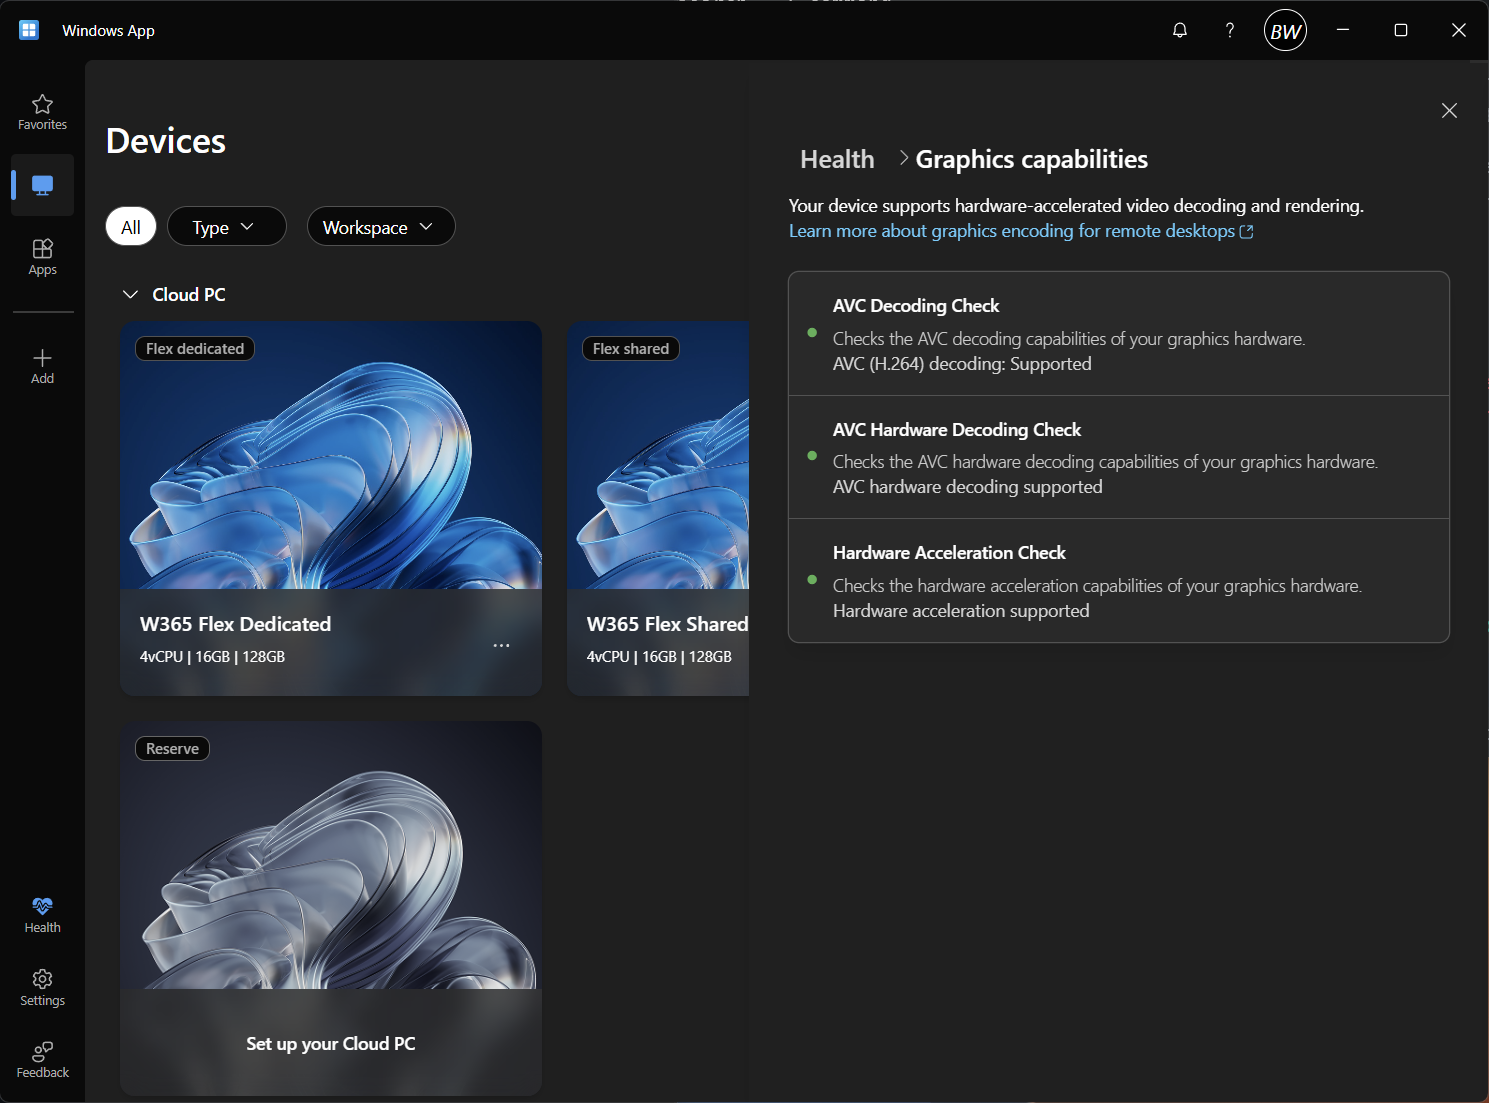
The documented checks include network connectivity, service reachability, and Windows version compatibility. The interface shown in this article also includes graphics capability details.
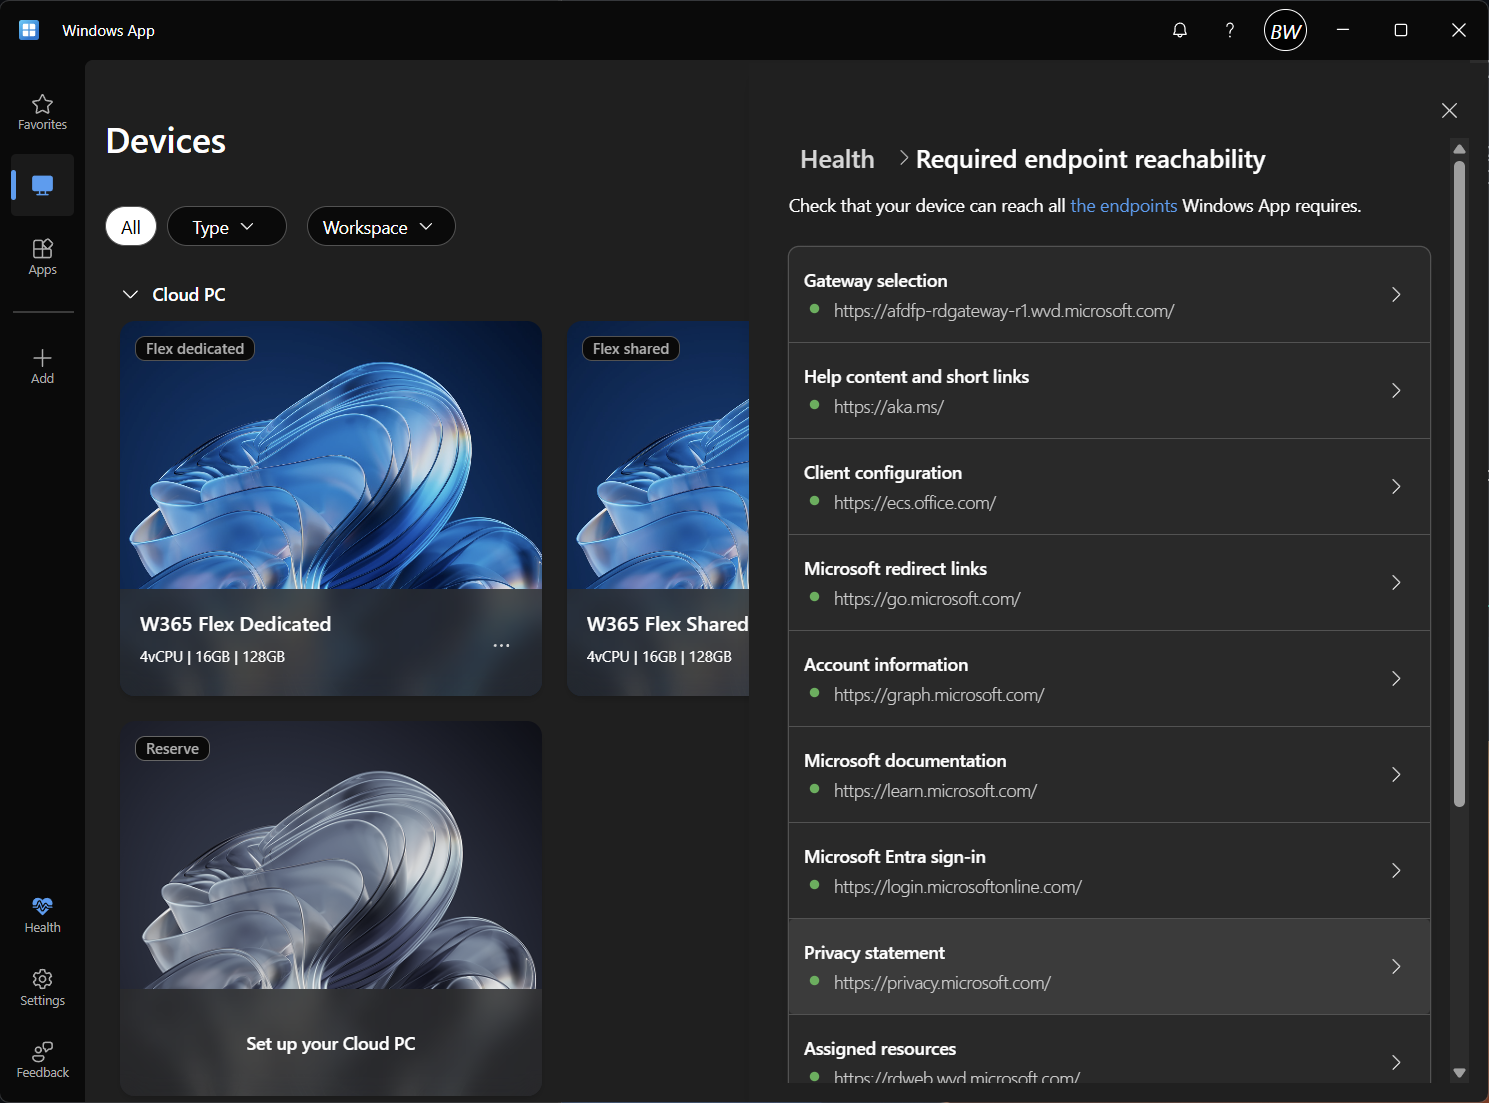
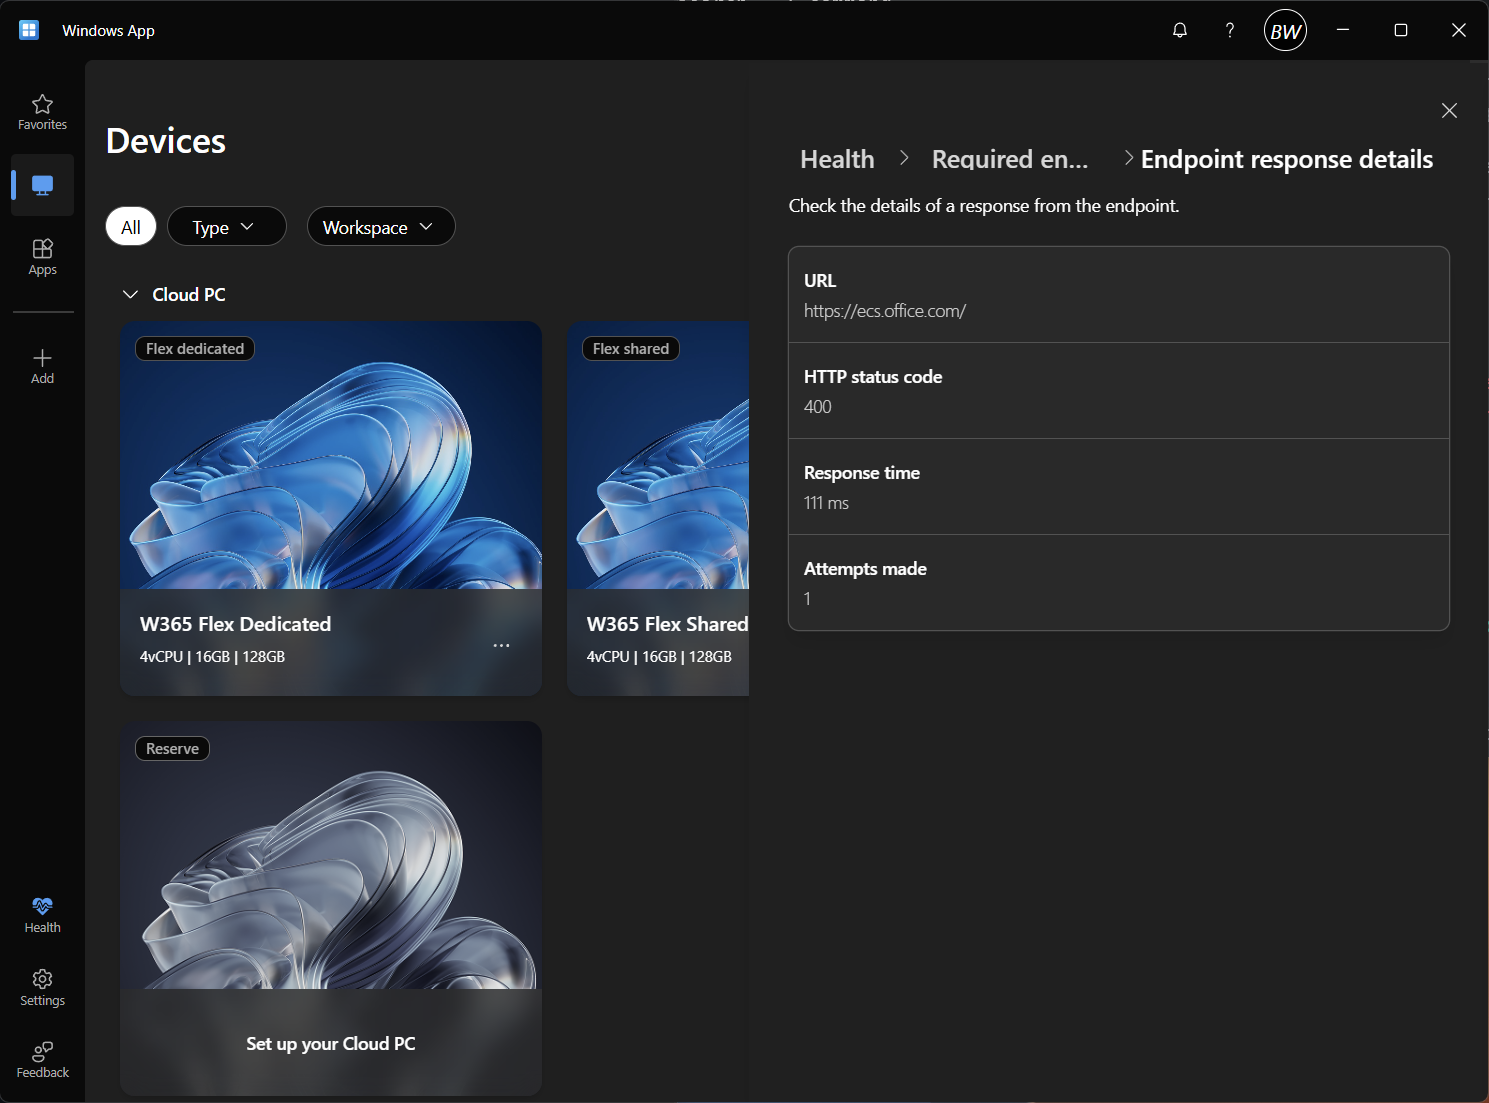
If you suspect an endpoint is blocked, open Required endpoint reachability. Review the destination, result, HTTP status code, and response time where available. Expand the individual attempts to see whether the failure is consistent.
Graphics capability details can be useful when investigating rendering or decoding issues, but they are not a substitute for checking connectivity.
When a health check reports an issue, review its details and recommended action.
Open the Logs#
From Health, select Open log to review the health check log. The interface shown here also provides access to the log folder.
For manual collection, Microsoft documents the Windows log location as %temp%\DiagOutputDir\Windows365\Logs. Its instructions recommend closing remote connections and Windows App before copying the files.
The following descriptions reflect the log files covered in this article. File names, contents, and detail levels can vary by version and by the activity captured.
| Log or folder | When it is useful |
|---|---|
health_checks.log | Reviewing local health checks, endpoint reachability, response times, and device capability information. |
error.log | Finding reported application errors, sign-in failures, and failed network or connection requests. |
startup.log | Establishing when the app launched and correlating startup activity with other logs. |
Windows365-WebView-instance.log | Investigating sign-in interface activity, account resolution, and feature rollout configuration. |
WindowsApp-BackgroundTasks.log | Investigating background maintenance or update activity. |
wnc folder | Reviewing native connection component logs, including ConnectionManager and ConnectionCenterServer activity. |
For a connectivity issue, I would usually start with the health check and error logs. For a sign-in issue, I would also review the WebView log. Use timestamps and correlation or session identifiers, where present, to connect events across files.
Collect Advanced Diagnostics#
The Windows App includes Collect advanced diagnostics. This provides a guided way to reproduce an issue and collect additional diagnostic information.
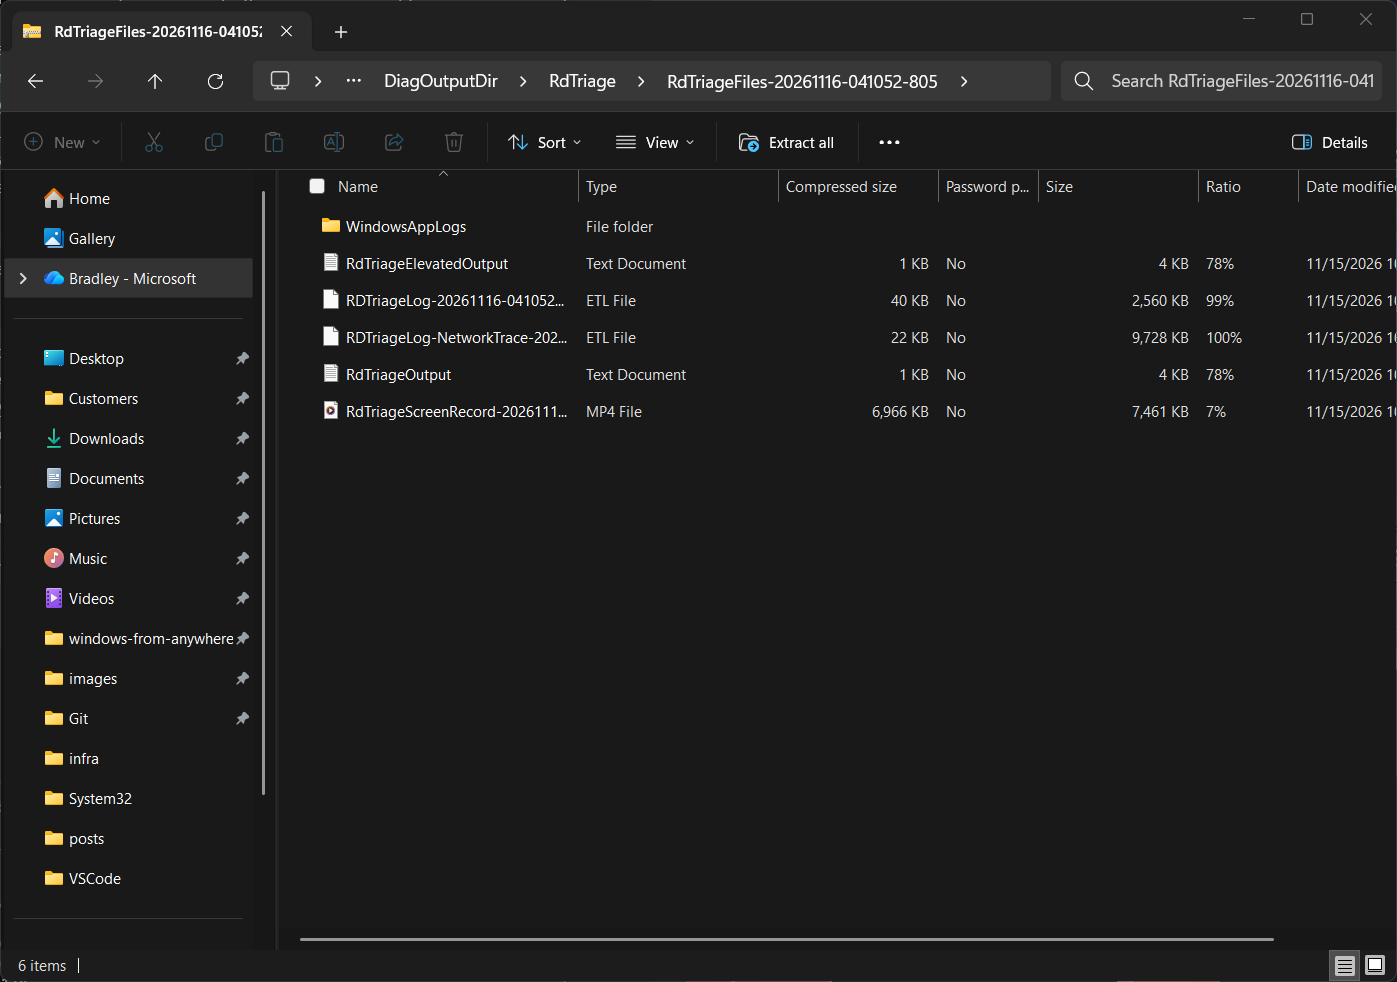
Review the collection options before starting. In this workflow, you can choose whether to allow screen recording and network log collection.
This workflow will disconnect active remote sessions so it can collect video and logs of the user signing in. A disconnection is different from signing out, so applications normally remain running on the Cloud PC. Save work and coordinate with the user before collecting diagnostics.
Start the collection, reproduce the issue, then select Finish. The output location shown for this workflow is %LocalAppData%\Temp\DiagOutputDir\RdTriage. The package can contain logs and, if recording was enabled, an .mp4 recording.
Connection Information#
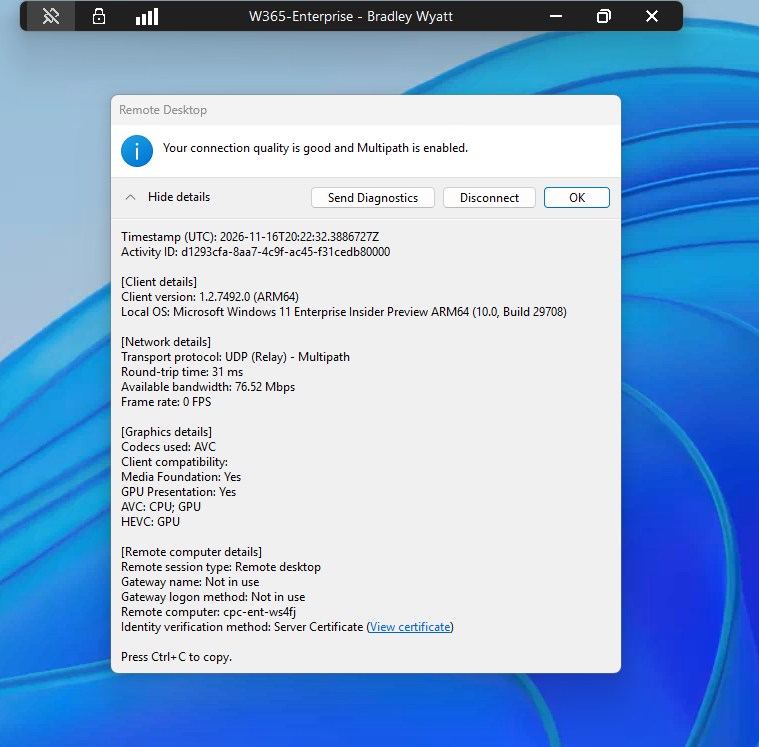
When a user is connected to a Cloud PC they can click the network bar icon and view networking, graphics, client and computer details.
Microsoft Intune Admin Portal#
Client-side diagnostics are only part of the investigation. If the problem affects multiple users or occurs in both clients, also review the service and Cloud PC.
The Windows 365 management area is under Devices > Manage Windows 365 Cloud PCs. Navigation labels can vary between portal experiences, so I have also included alternate entry points where useful.
Check Cloud PC Connectivity in Intune#
In the Microsoft Intune admin center:
- Go to Devices > Manage Windows 365 Cloud PCs > All Cloud PCs.
- Select the affected Cloud PC.
- Open Overview > Performance.
- Review its connectivity status and any failed checks.
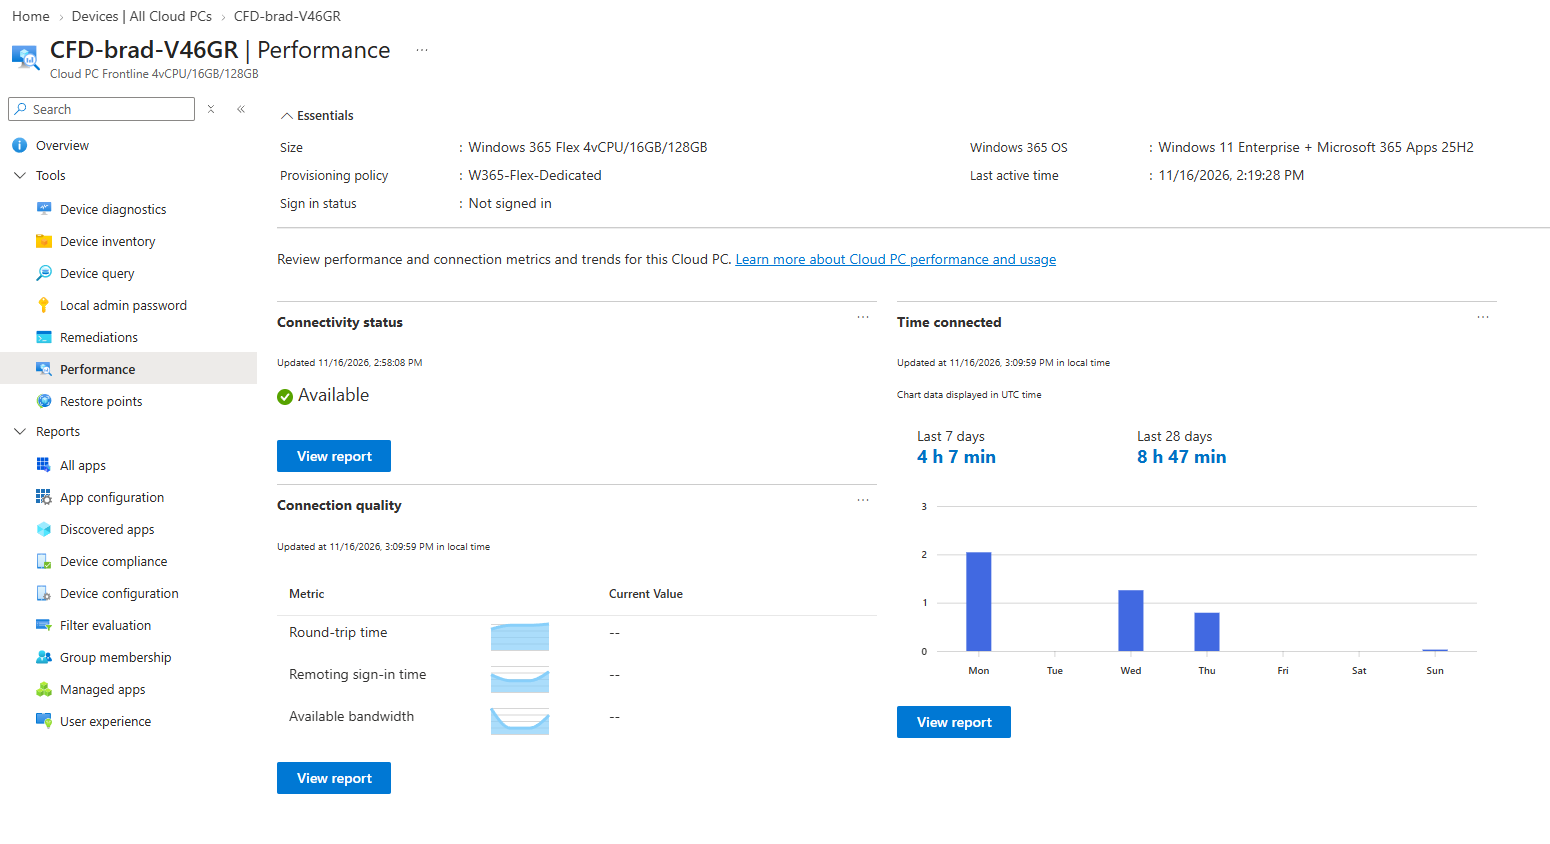
These service-side checks are different from the health checks in Windows App on the user’s device.
Microsoft documents Troubleshoot this connection as available when the Cloud PC connectivity status is Unavailable. As with the user-facing inspection, it can temporarily prevent connections to the Cloud PC.
For Flex in Shared mode, interpret availability in context. A Cloud PC can be In use during a session or Unavailable (Servicing) during the reset process after sign-out. A temporary servicing state is not automatically a network failure.
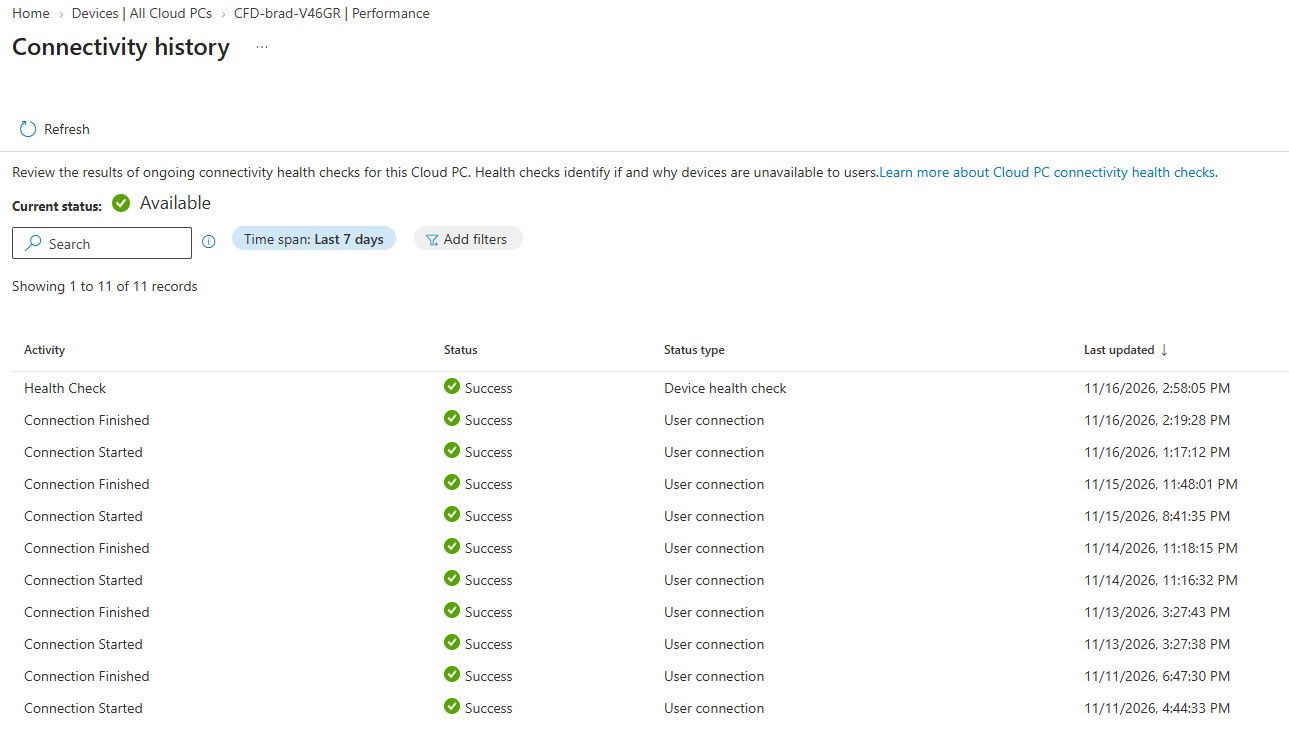
Review Connection History#
From the same Performance page, select View report under Connectivity status.
Compare connection start and finish events with the user’s failure timestamp. Review failed connectivity checks and the event details to understand what the service recorded.
If the user connects successfully but reports poor performance, also investigate Cloud PC resource usage. Client network metrics alone do not rule out CPU, memory, or application-related issues.
Review Connection Quality#
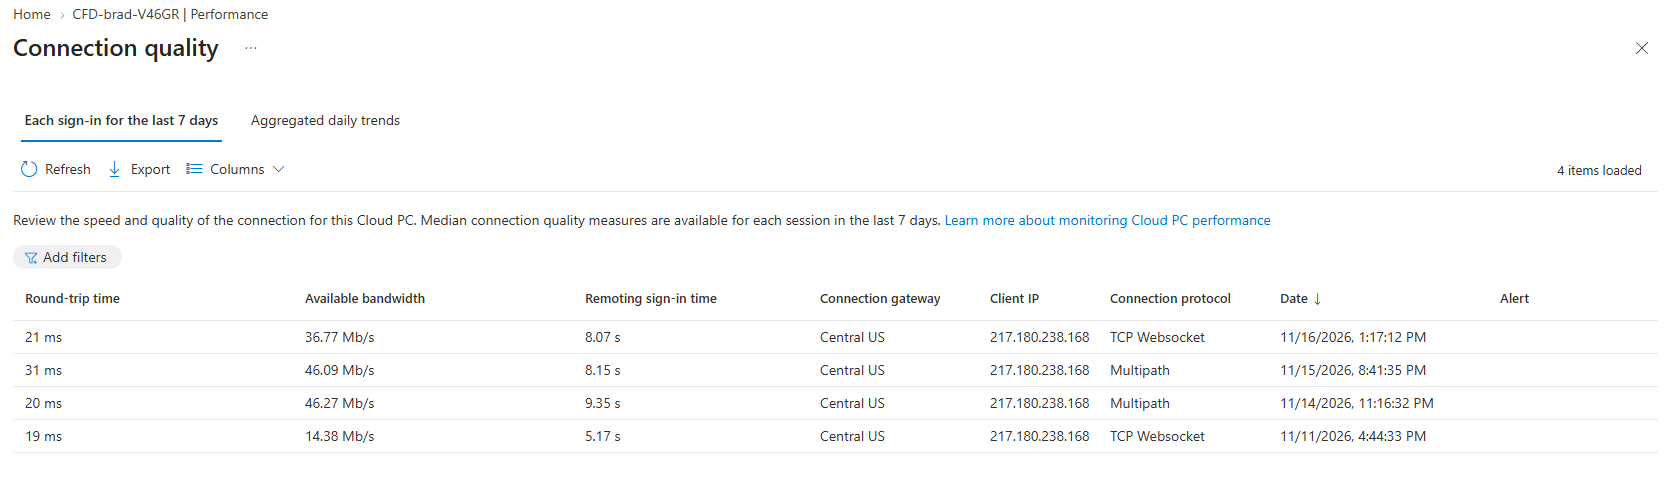
On the Cloud PC’s Performance page, review the connection quality information alongside its connectivity history. You can also open the fleet-level report from Reports > Cloud PC overview > Connection quality, then select a Cloud PC for more detail.
Depending on the view, useful fields include:
- Round-trip time (RTT): Transport latency between the client and Cloud PC, measured in milliseconds.
- Available bandwidth: Bandwidth observed during the remote session, not a general internet speed test.
- Remoting sign-in time: How long the remote sign-in process took.
- Connection gateway and protocol: Details that can help explain differences between otherwise similar sessions.
- Client IP address and UDP utilization: Additional context for comparing connection paths and transport use.
Compare the most recent session with the selected reporting period. Where the portal provides daily trends, use them to see whether the issue is isolated or recurring.
I would use this report to establish a pattern, not to declare a root cause from a single number. Higher RTT can help explain a slow-feeling session, but it does not identify whether distance, routing, congestion, or another factor caused the increase.
Collect Device Diagnostics#
Client logs describe what happened on the user’s local device. Collect diagnostics gathers troubleshooting data from the managed Cloud PC instead. These are complementary sources of evidence, not interchangeable collections.
- From All Cloud PCs, select the affected Cloud PC and open its managed device page if needed.
- Select Collect diagnostics, then confirm.
- You can view the status and download the diagnostics by clicking “Device diagnostics” on the left pane in the Tools section.
The resulting .zip can include event logs, registry data, diagnostic command output, and files such as diagnostic cabinets. The exact contents depend on the device and the available data.
Unlike Windows App’s advanced diagnostic workflow, Intune’s device diagnostic collection is designed not to interrupt the user. However, the Cloud PC must be online and able to communicate with Intune and the diagnostic upload endpoints. If collection remains pending or fails, check those dependencies rather than assuming there is no useful data.
The administrator needs permission to collect diagnostics and access the device. Microsoft currently retains collections for 28 days, with up to 10 collections per device, so download the relevant package before it expires.
Monitor Cloud PCs#
The Monitor Cloud PCs entry under Manage Windows 365 Cloud PCs provides another starting point for investigating users and devices. Microsoft also documents access through Reports > Cloud PC monitoring (preview).
Microsoft currently documents Cloud PC monitoring as a public preview. Features and availability can change, and scope tags are not supported in the preview. Review the current limitations before relying on it for your support workflow.
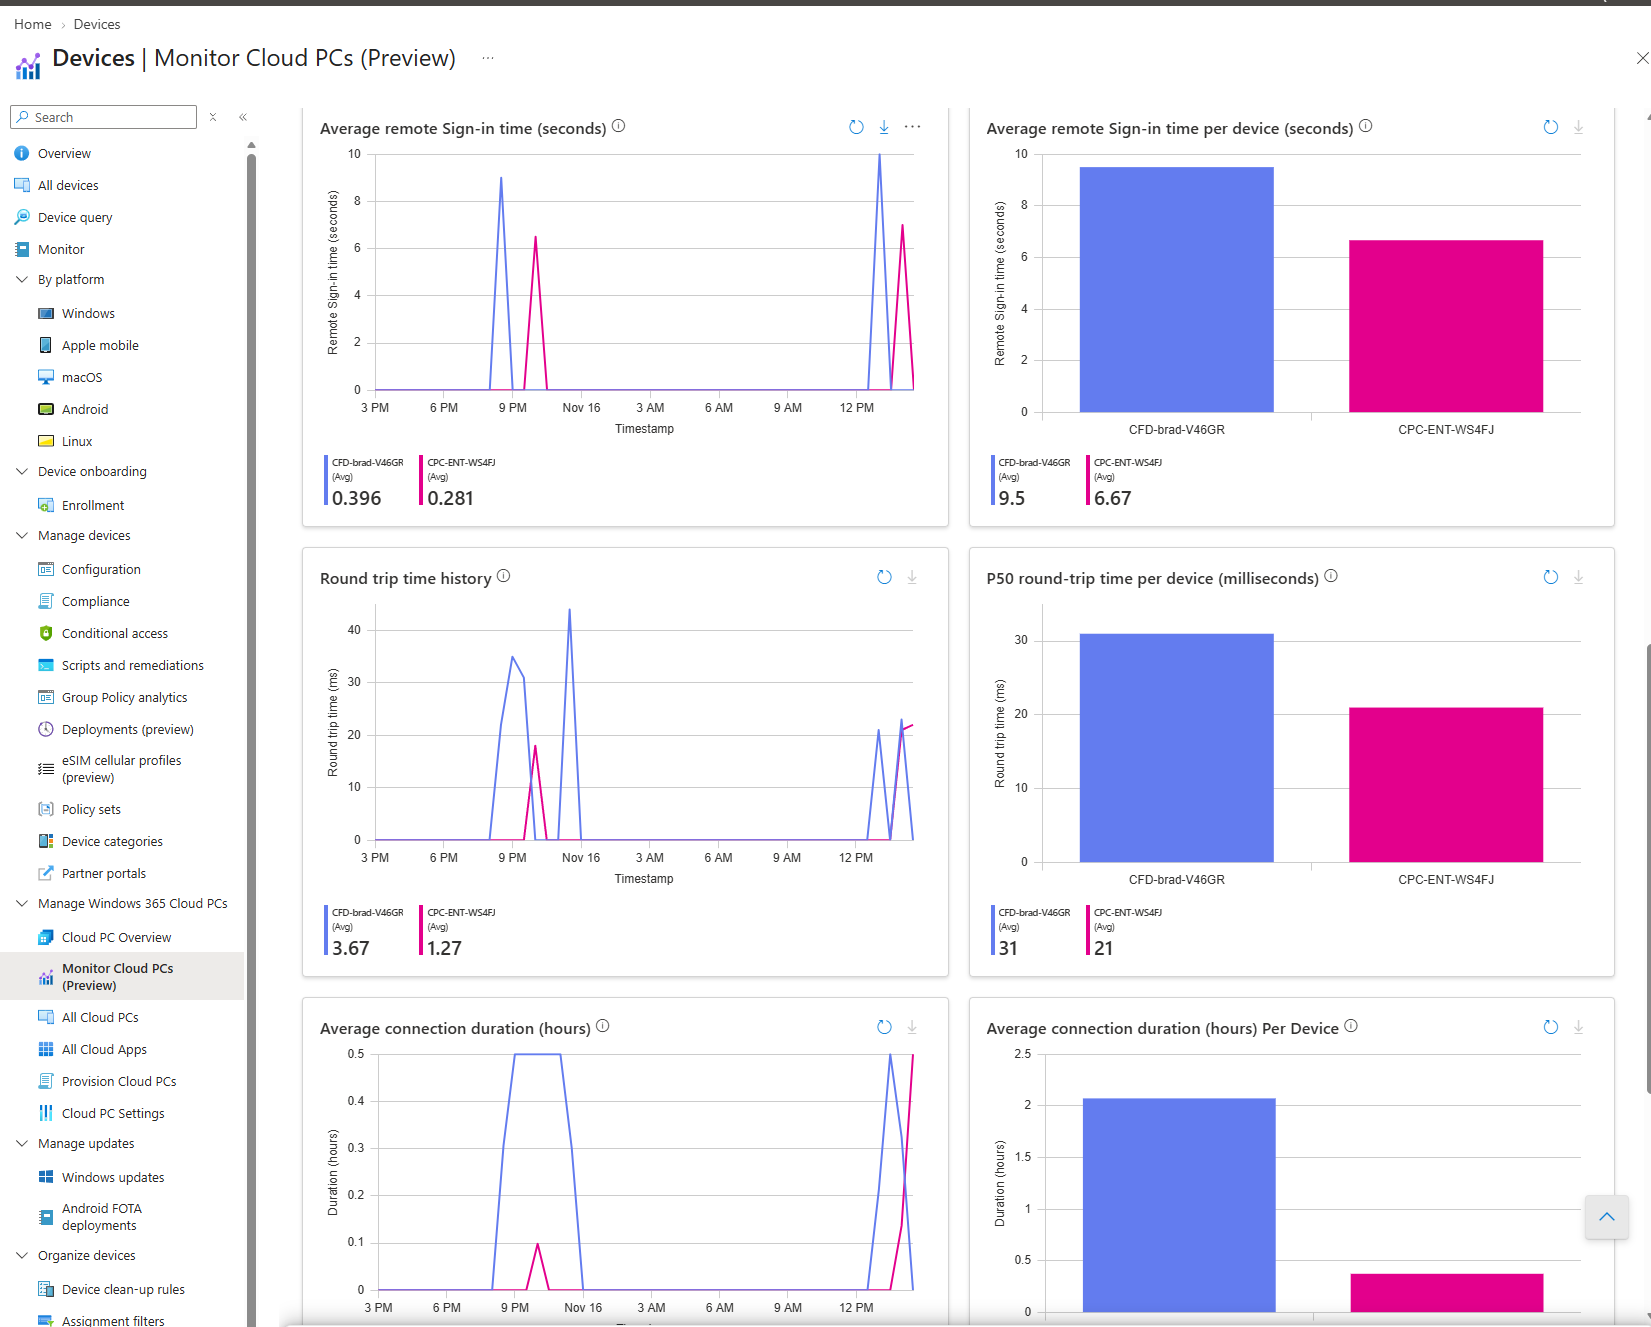
Start with Connection health when several users report a problem. Set the time range to the incident window, then group or filter by factors such as region, client type, or operating system to see whether the issue is concentrated in one group.
For an individual incident:
- Open User and devices and search for the user or device.
- Select the affected Cloud PC, especially if the user has more than one.
- Set the time range to cover the reported issue.
- Compare connection failures, round-trip time, remoting sign-in time, and Cloud PC health trends.
- Open View data and inspect the events and connection configuration around the failure.
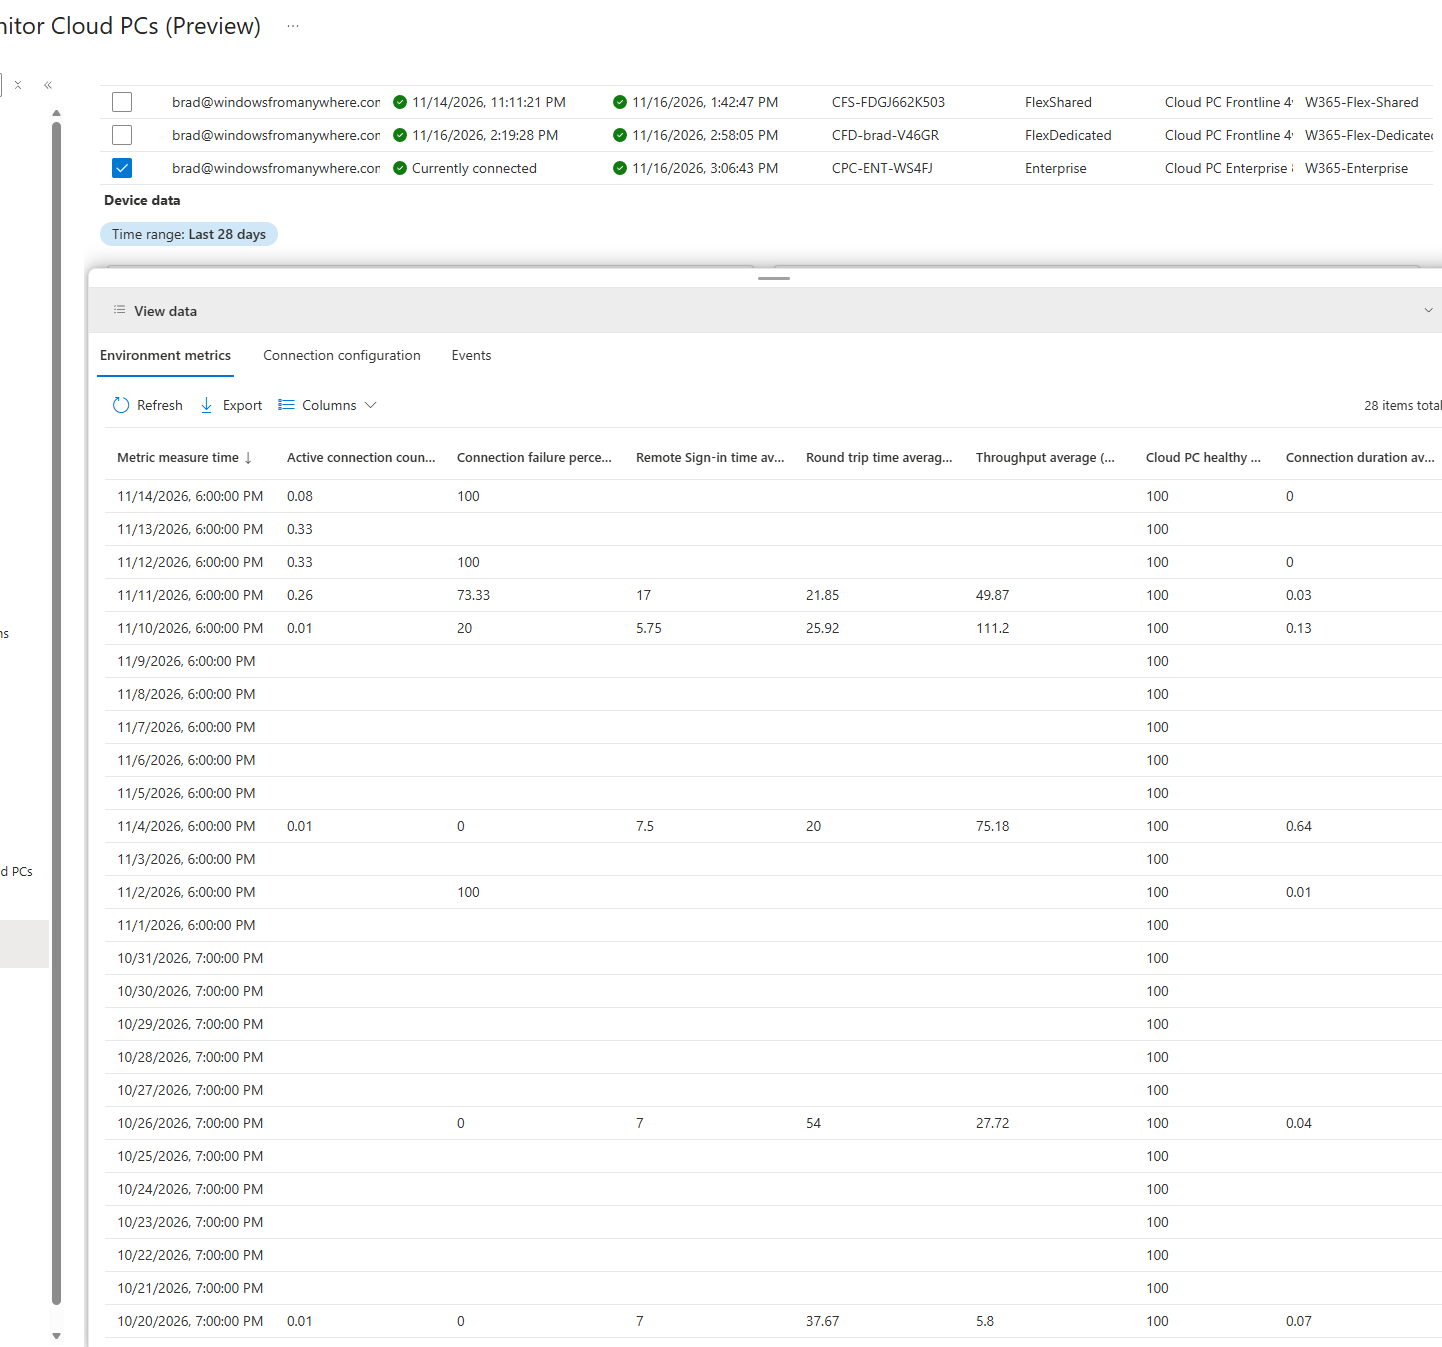
This is useful for connecting a user’s report to a specific event. For example, a network-loss event at the reported time gives you a different starting point than a drop in Cloud PC health affecting several devices.
Do not treat this dashboard as a live trace. Microsoft documents connection data delays of up to 15 minutes and Cloud PC health data delays of up to 30 minutes. The pages do not automatically refresh, so refresh before deciding whether a recent action changed the result.
Troubleshoot Multiple Cloud PCs#
If the evidence points to a shared issue, Bulk device actions can run Troubleshoot against multiple Cloud PCs. Use the option where it is available in your Cloud PC view, or open Devices > All devices > Bulk device actions.
Select only the affected devices, review the action and target list, and coordinate with users before submitting it. Connection troubleshooting can prevent connections and might restart a Cloud PC, so running it broadly without first narrowing the scope can disrupt users who were not affected.
Track progress in Devices > Monitor > Cloud PC actions. The report separates single-device actions from bulk batches and shows pending, successful, or failed actions.
Microsoft Graph API#
Administrators can use the Microsoft Graph cloudPC: troubleshoot endpoint to start a troubleshoot against a Cloud Pc.
Permissions and Request#
The API supports delegated work or school accounts and application permissions, and requires CloudPC.ReadWrite.All. For delegated use, the signed-in user must be an administrator. This is a write permission, so use an approved administrative identity or application and obtain the required consent.
The request is a POST to the Cloud PC’s troubleshoot endpoint, with no request body. Use the Cloud PC resource ID, not the Intune managed device ID or Microsoft Entra device ID.
For example, you can use the REST Client extension for Visual Studio Code with this request:
POST https://graph.microsoft.com/v1.0/deviceManagement/virtualEndpoint/cloudPCs/{{cloudPCId}}/troubleshoot
Authorization: Bearer {{accessToken}}
Set cloudPCId to the affected Cloud PC’s resource ID and provide an access token authorized for Microsoft Graph with the required permission.
Monitor the Result#
A successful request returns 204 No Content, not a diagnostic report. Do not treat that response alone as proof that the user’s connection problem is resolved. Recheck the Cloud PC’s status and have the user test the connection.
In the portal experience shown below, the Cloud PC’s Overview page displays the troubleshooting action.
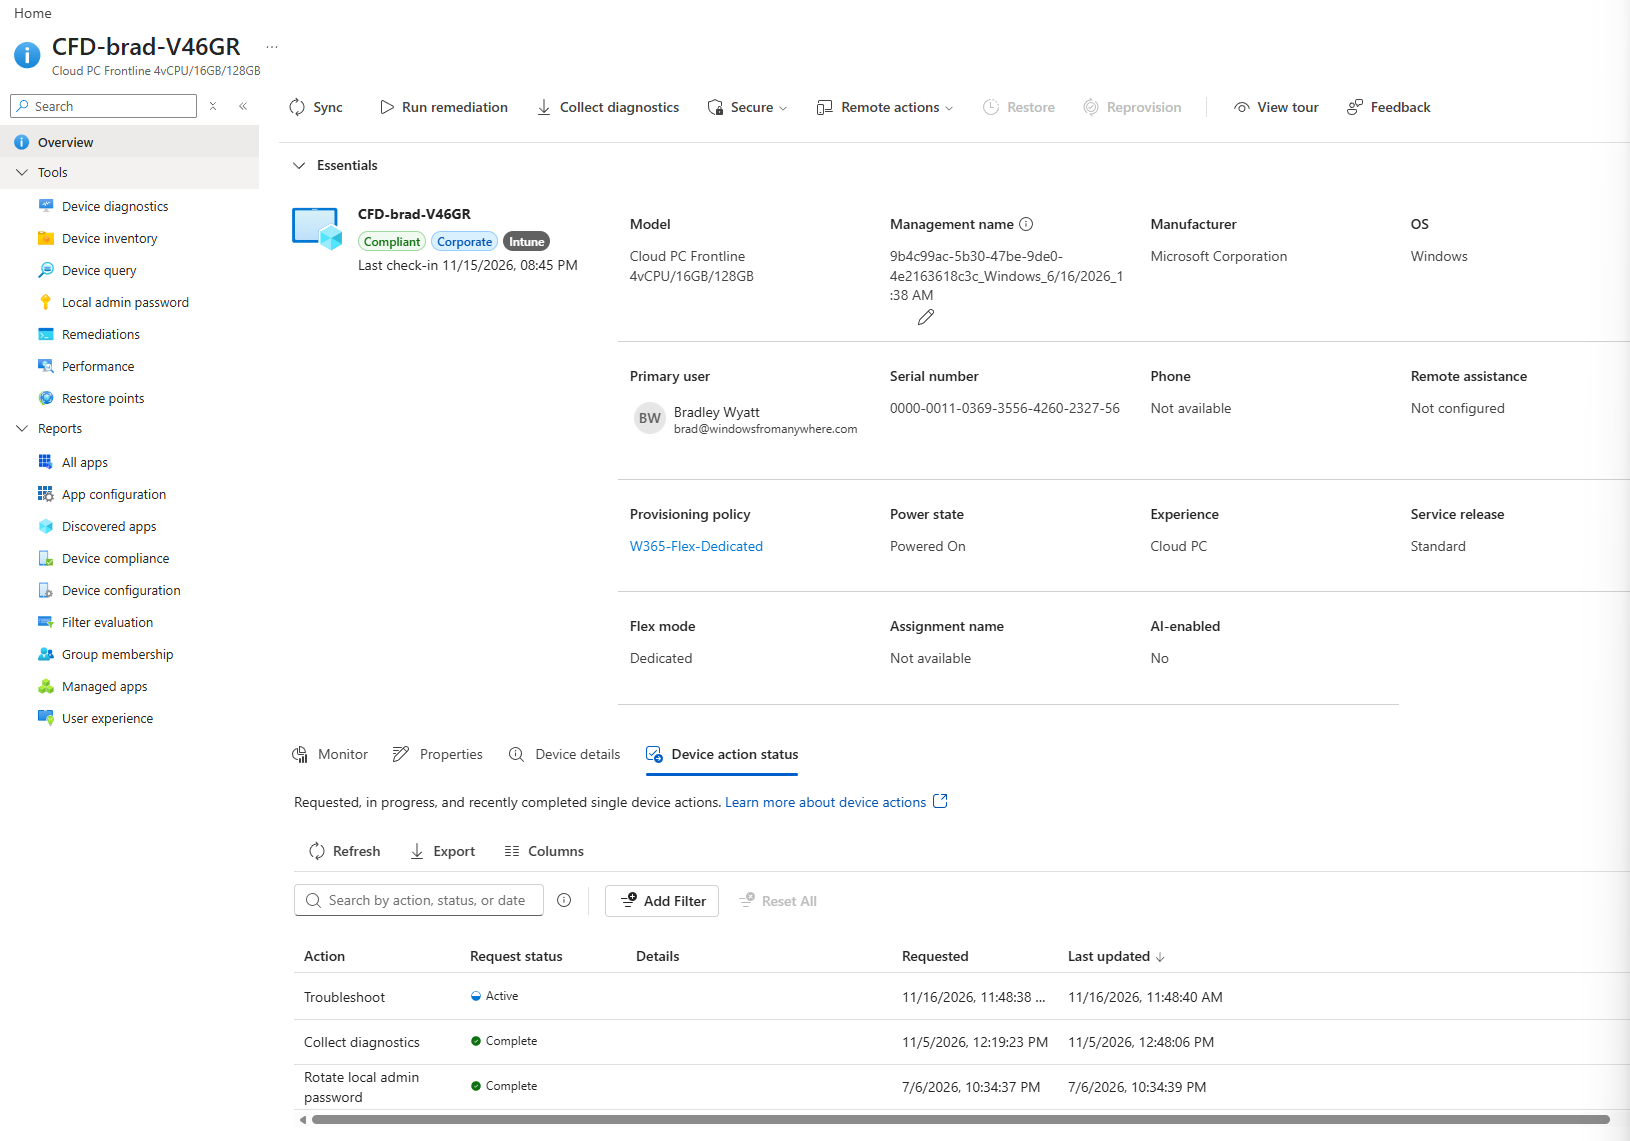
The troubleshoot API does not collect the device diagnostic package described earlier. Use Collect diagnostics in Intune for that workflow.
For an individual incident, the Intune interface may be the simpler option. Graph is useful when you need to incorporate the action into an existing administrative workflow.
Windows 365 Connectivity Tool#
I would also recommend looking at the Windows 365 Connectivity Diagnostics tool and its GitHub project. It brings together network readiness checks and connection diagnostics for Windows 365 and Azure Virtual Desktop in one dashboard.
The useful distinction is where you run it. Browser tests provide a quick starting point. The Windows Local Scanner adds checks that a browser cannot perform, and running the scanner inside the Cloud PC gives you the other side of the connection. With an active session, it can also collect session-specific diagnostics.
The project is in preview, so available checks and labels can change. Some checks require a particular environment, an active session, or accessible event logs and performance counters. A skipped or unavailable check is not automatically a failure.
Browser Tests#
Open the web dashboard and select Run Browser Tests. These checks do not require downloading the scanner. Below are only some of the checks it will perform:
- Required endpoint reachability: Probe HTTPS access to the configured Windows 365 and AVD service endpoints.
- Connection speed: Estimate download throughput using a browser-based speed test.
- Captive portal detection: Look for a hotel, guest Wi-Fi, or similar sign-in page intercepting internet access.
- Endpoint connectivity timing: Measure combined DNS, TCP, and TLS connection timing to key service endpoints.
- Azure Front Door connectivity: Test access to the gateway discovery edge and measure HTTPS connection timing.
- DNS and routing overview: Present the endpoint and path information available to the browser. Full DNS-chain analysis and ICMP traceroute require the scanner.
- STUN connectivity: Use WebRTC to gather connection candidates and assess STUN reachability.
- NAT assessment: Analyze WebRTC candidates for indications of NAT behavior and compatibility with direct UDP connectivity.
- TURN endpoint reachability: Use a WebRTC STUN probe against the relay endpoint to assess the UDP 3478 path. This is not a full authenticated TURN allocation or proof that an RDP session is using the relay.
Browser checks have limits. CORS, tracking protection, mixed-content restrictions, and WebRTC policy can affect what can be tested. Browser endpoint timings include more than DNS lookup time and are not equivalent to a ping or the active RDP session’s RTT. Wildcard endpoint checks use representative hosts, not every possible hostname.
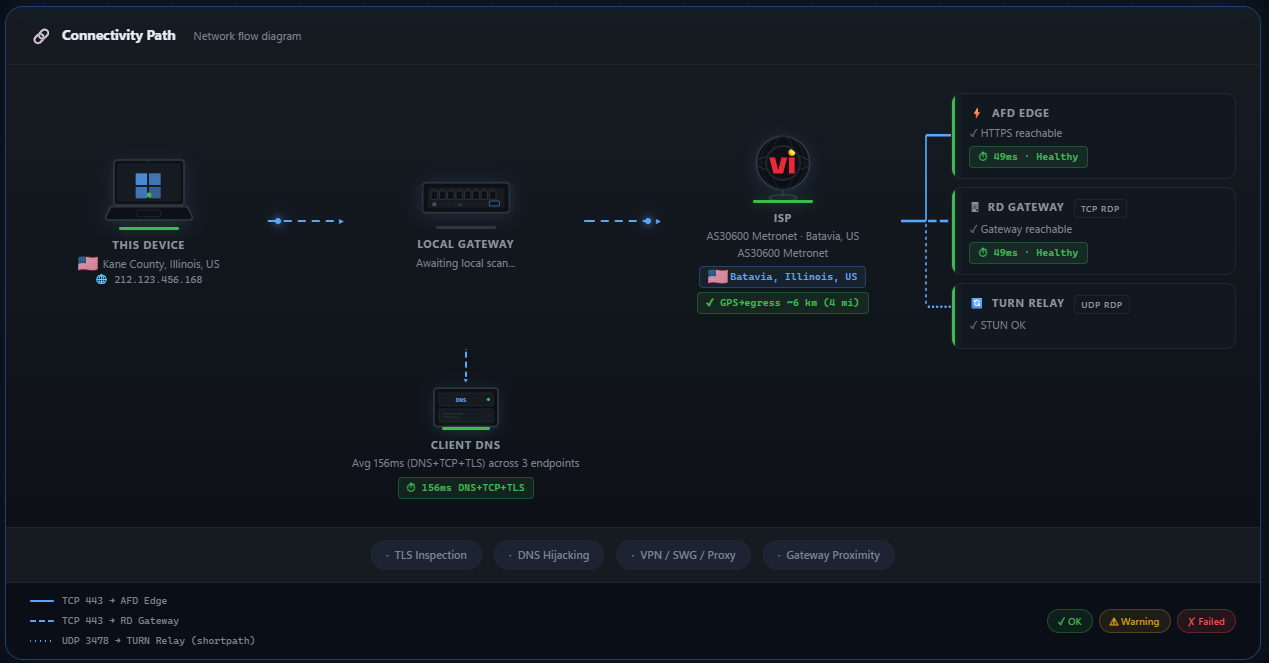
Local Scanner on the User’s Device#
Download the Windows scanner from the project’s releases and run it on the device used to connect to the Cloud PC. The project documents a self-contained executable that does not require installation or administrator rights.
The scanner saves W365ScanResults.json and normally opens the dashboard with its results. It adds the following checks beyond the browser tests (listed are only some, not all of the additional checks).
Device and Local Network#
- Wi-Fi signal strength: Report wireless signal and connection details.
- Wi-Fi channel congestion: Inspect nearby wireless networks for channel overlap and congestion.
- Router/gateway latency: Measure responsiveness of the local default gateway.
- Bandwidth estimation: Run an additional download-based throughput estimate.
- Teams optimization: Check local Teams media optimization and AV redirection indicators.
- Windows Firewall audit: Look for rules that could block required connectivity.
- RDP Group Policy checks: Inspect policy and registry settings that can restrict RDP or disable UDP transport.
- RDP client version: Identify the installed Windows App or Remote Desktop client version.
- DNS server identification: Identify configured and active resolvers, provider information, and available encrypted-DNS indicators.
- Path MTU discovery: Probe the maximum packet size along paths to key endpoints.
- Network stack agents: Inventory VPN, SWG, proxy, and security components that could affect the network path. Their presence alone does not establish that they are causing a problem.
Endpoint, DNS, and TCP Connectivity#
- Browser-blocked endpoints: Check destinations that browser tracking protection can prevent the web tests from assessing.
- DNS resolution performance: Measure operating-system DNS lookup timing separately from TCP and TLS setup.
- Gateway and service connectivity: Check Azure Front Door gateway discovery, RD Gateway access, RDWeb feed connectivity, and authentication endpoint access.
- DNS CNAME chain analysis: Trace gateway name resolution, including indicators of Azure Front Door or Private Link routing.
- DNS integrity checks: Look for unexpected gateway DNS results that could indicate redirection or interception.
- Gateway identification: Report the gateway endpoint reached, IP address, routing indicators, and available location or proximity information.
- TLS inspection detection: Inspect certificate chains for signs of interception.
- Proxy, VPN, and SWG detection: Review system and WinHTTP proxy settings, PAC/WPAD configuration, environment settings, adapters, and relevant processes.
- Network path trace: Run ICMP traceroute toward key Windows 365 or AVD endpoints.
UDP and Shortpath Connectivity#
- TURN relay reachability: Send raw UDP probes to the relay on port 3478.
- TURN relay location: Resolve the relay and estimate its location.
- STUN NAT assessment: Compare STUN responses to assess NAT behavior and potential Shortpath compatibility.
- TURN TLS inspection: Check for interception on the relay’s TLS endpoint, separately from the UDP test.
- TURN proxy/VPN detection: Look for proxy, VPN, or firewall conditions that could interfere with UDP relay connectivity.
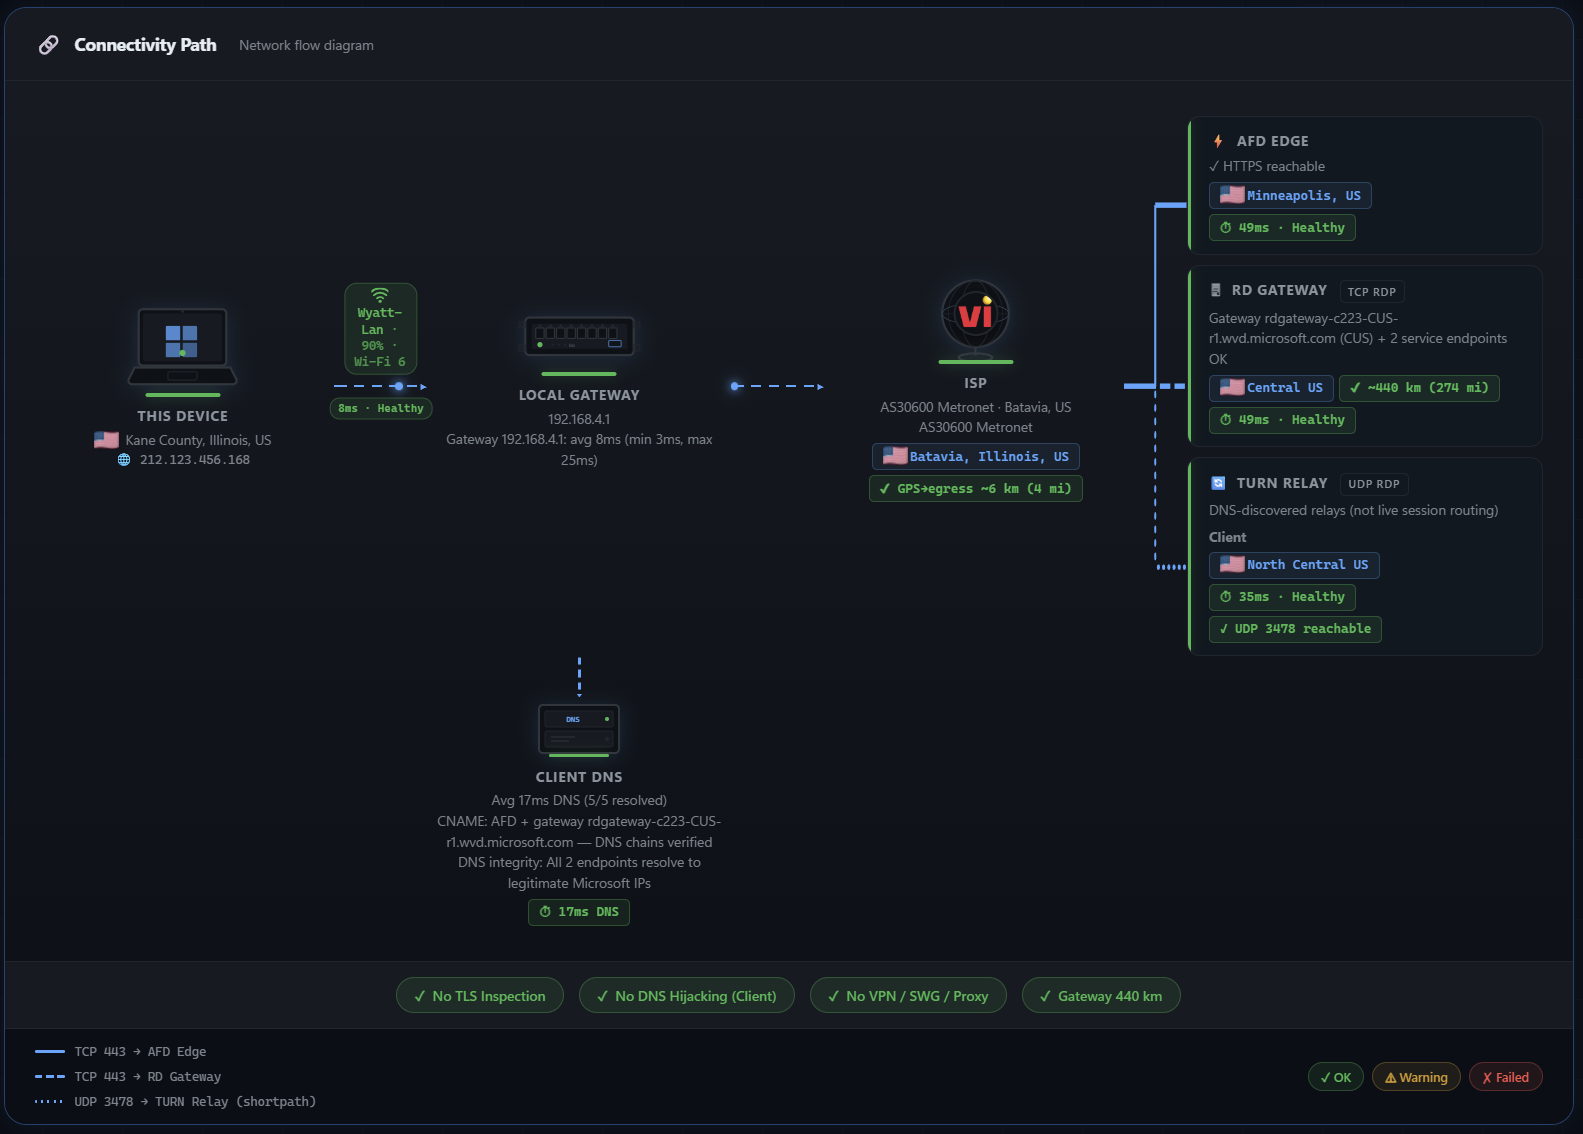
Scanner Inside the Cloud PC#
Run the same scanner inside the affected Cloud PC or AVD session host to investigate its outbound path.
Host-side checks include:
- Required service endpoints: Test the endpoint set for the selected host type, including applicable provisioning, activation, monitoring, marketplace, and certificate-related services.
- Cloud PC location: Identify its Azure region and public egress IP information.
- Cloud PC network information: Collect adapter, provider, and Azure hosting details.
- Network stack agents: Inventory VPN, SWG, proxy, and security components inside the host.
- Connection speed: Estimate throughput from the Cloud PC.
- DNS performance and integrity: Measure host-side DNS lookup timing, examine gateway CNAME chains, and check for unexpected DNS results. Browser tests run inside the Cloud PC can also provide combined DNS/TCP/TLS timings, shown separately.
- Gateway connectivity and identification: Test the gateway path from the host and report the endpoint reached.
- TLS inspection and proxy/VPN/SWG detection: Check the Cloud PC’s outbound path for interception or redirection.
- RDP egress assessment: Look for evidence that gateway and relay traffic is taking an unexpected path outside Azure.
- TURN connectivity: Test relay reachability, estimate relay location, and look for proxy or VPN interference.
- Managed-network Shortpath configuration: Check relevant policy, the UDP 3390 listener, firewall configuration, and operating-system support. This applies to managed-network Shortpath, not the public-network UDP 3478 relay path.
The Cloud PC also includes a browser test which looks like the following:
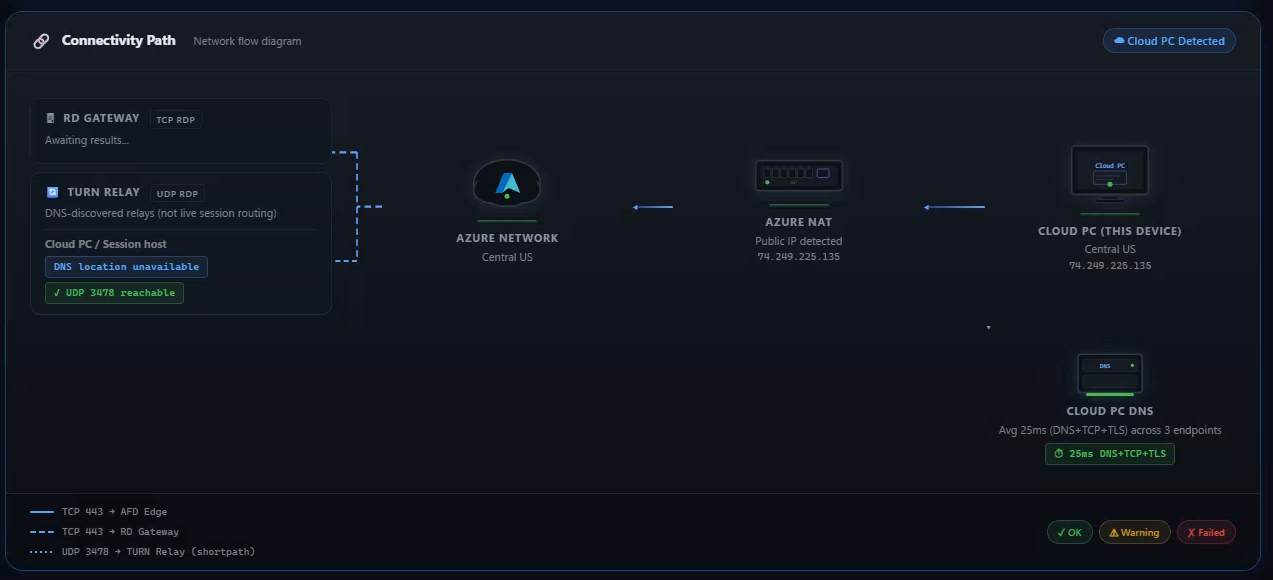
The diagram for the Cloud PC if you run the executable contains further information: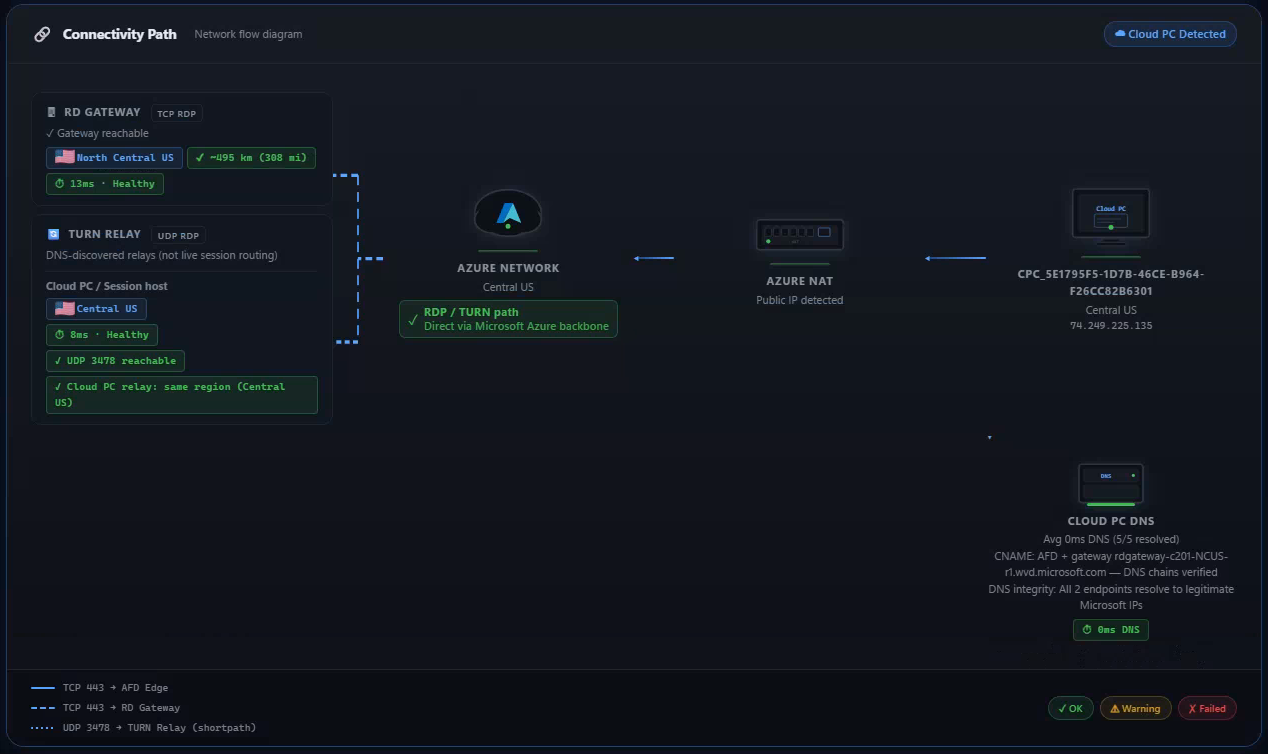
Live Connection Diagnostics#
Run the scanner while connected to the Cloud PC, on the local device or inside the remote session, to gather the diagnostics available from that side:
- Active RDP session detection: Identify a remote session or running RDP clients.
- RDP transport protocol: Look for evidence of TCP or UDP transport in event logs and available counters.
- UDP Shortpath readiness: Probe the UDP relay path for Shortpath availability.
- Session round-trip latency: Use session counters where available, or gateway probes as an alternative.
- Session frame rate and bandwidth: Read available graphics and connection performance counters.
- Connection jitter: Measure variation in probe timings.
- Frame drops and packet loss indicators: Use available session counters or connectivity probes.
- Cloud PC Teams optimization: Check media optimization and AV redirection status.
- VPN connection performance: Assess indicators that a VPN could be affecting connectivity.
- RDP TLS inspection: Check for interception on the gateway connection.
- RDP traffic routing: Assess whether RDP traffic bypasses VPN, proxy, and SWG tunnels.
- RDP local egress: Assess whether traffic is reaching a suitably local gateway rather than taking an unnecessary detour.
Pay attention to the measurement source. A gateway probe is not the same as an in-session counter, probe loss is not necessarily RDP packet loss, and Shortpath readiness is not confirmation of the negotiated transport.
Session Watch for Intermittent Problems#
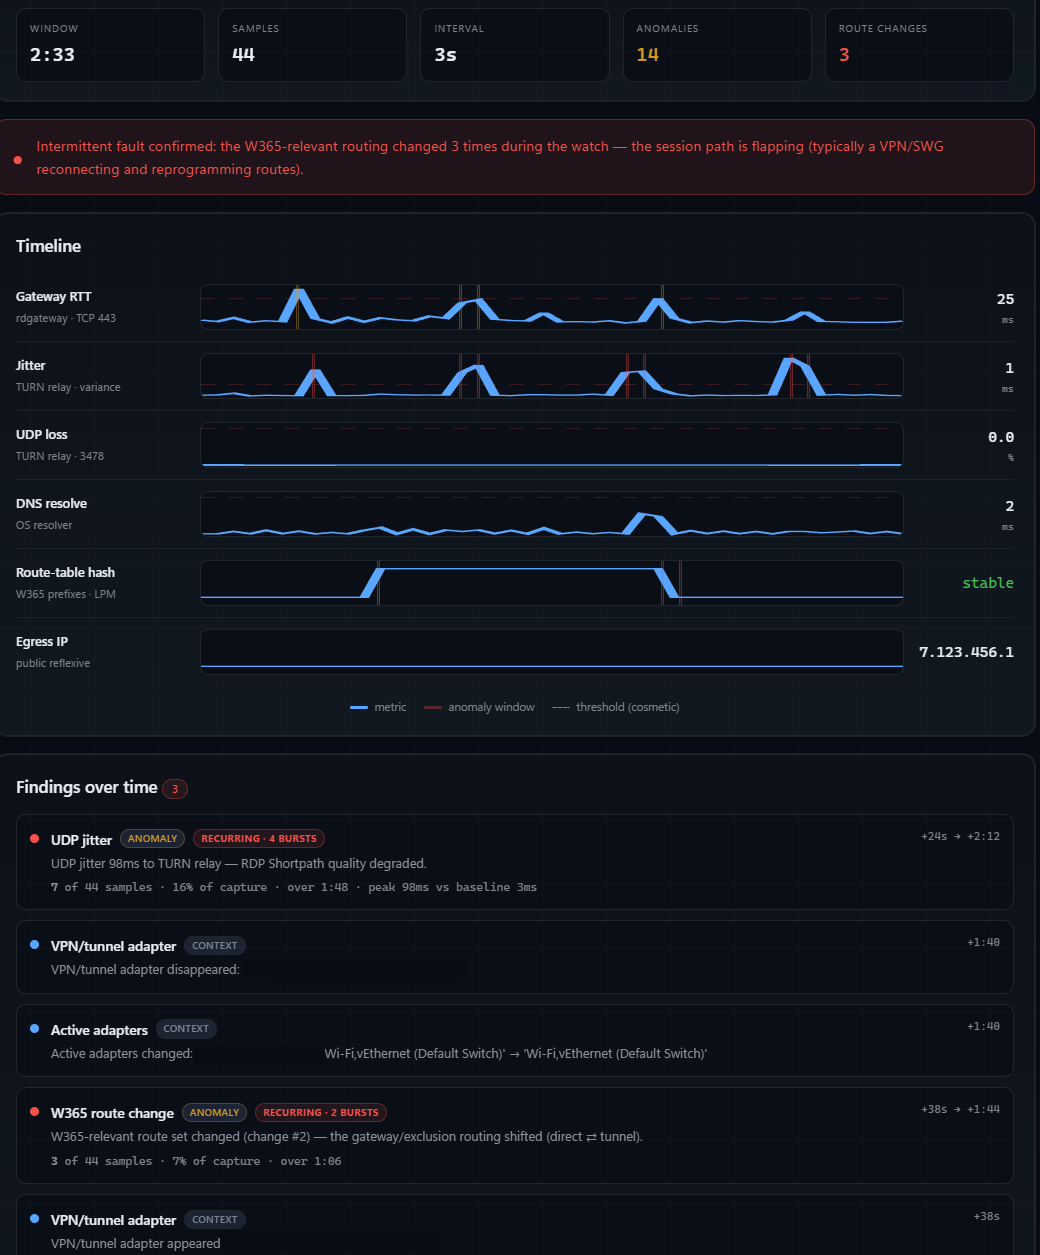
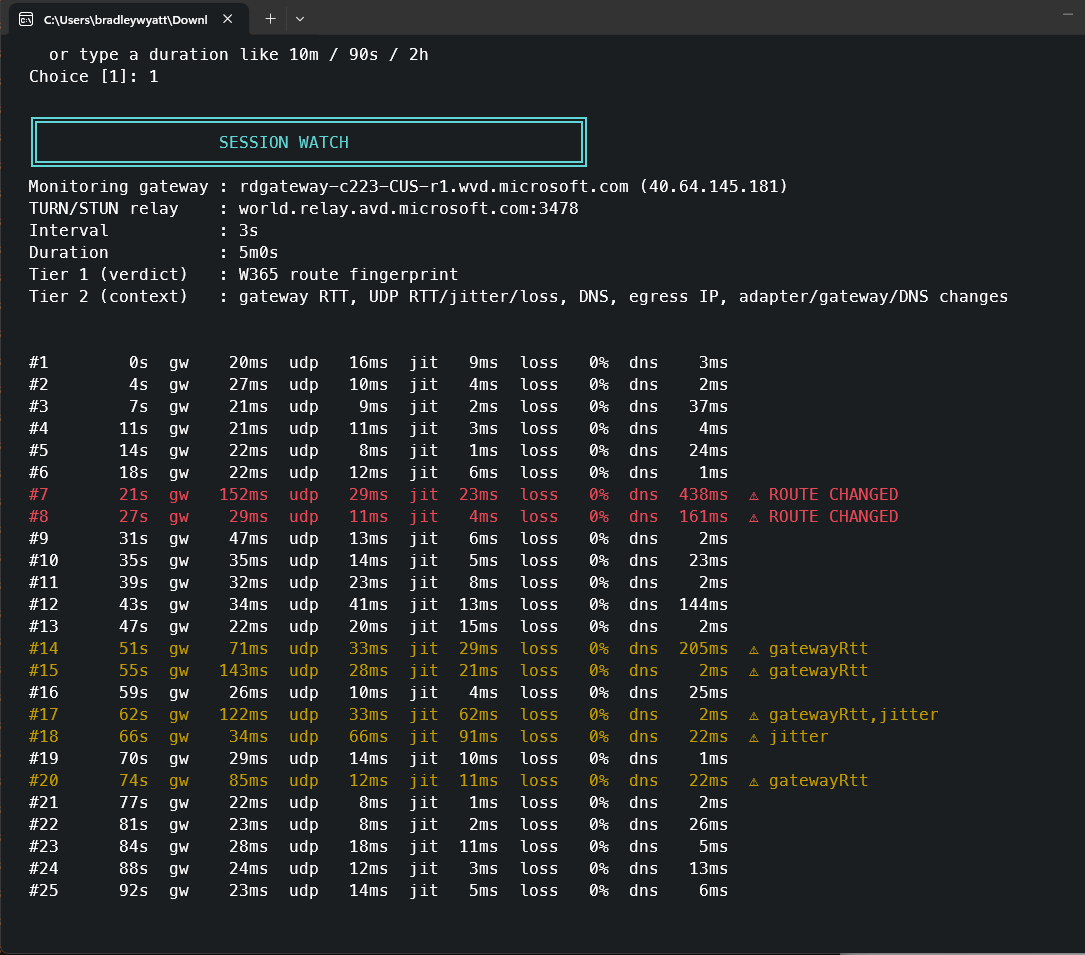
A one-time scan can miss a tunnel reset or routing change. The scanner also offers an opt-in Session Watch mode for continuous sampling.
It tracks gateway TCP connectivity and timing, UDP STUN timing, jitter and probe loss, DNS lookup timing, RDP-relevant route changes, public egress changes, and changes to adapters, VPNs, default gateways, and DNS servers. The resulting timeline helps correlate a reported interruption with a change in the network environment.
The documented options include --watch 5m for a timed capture, --watch until-stopped for an open-ended capture, and --interval to adjust sampling frequency. You can import the resulting W365WatchTimeline.json into the dashboard.
Review, Compare, and Share Results#
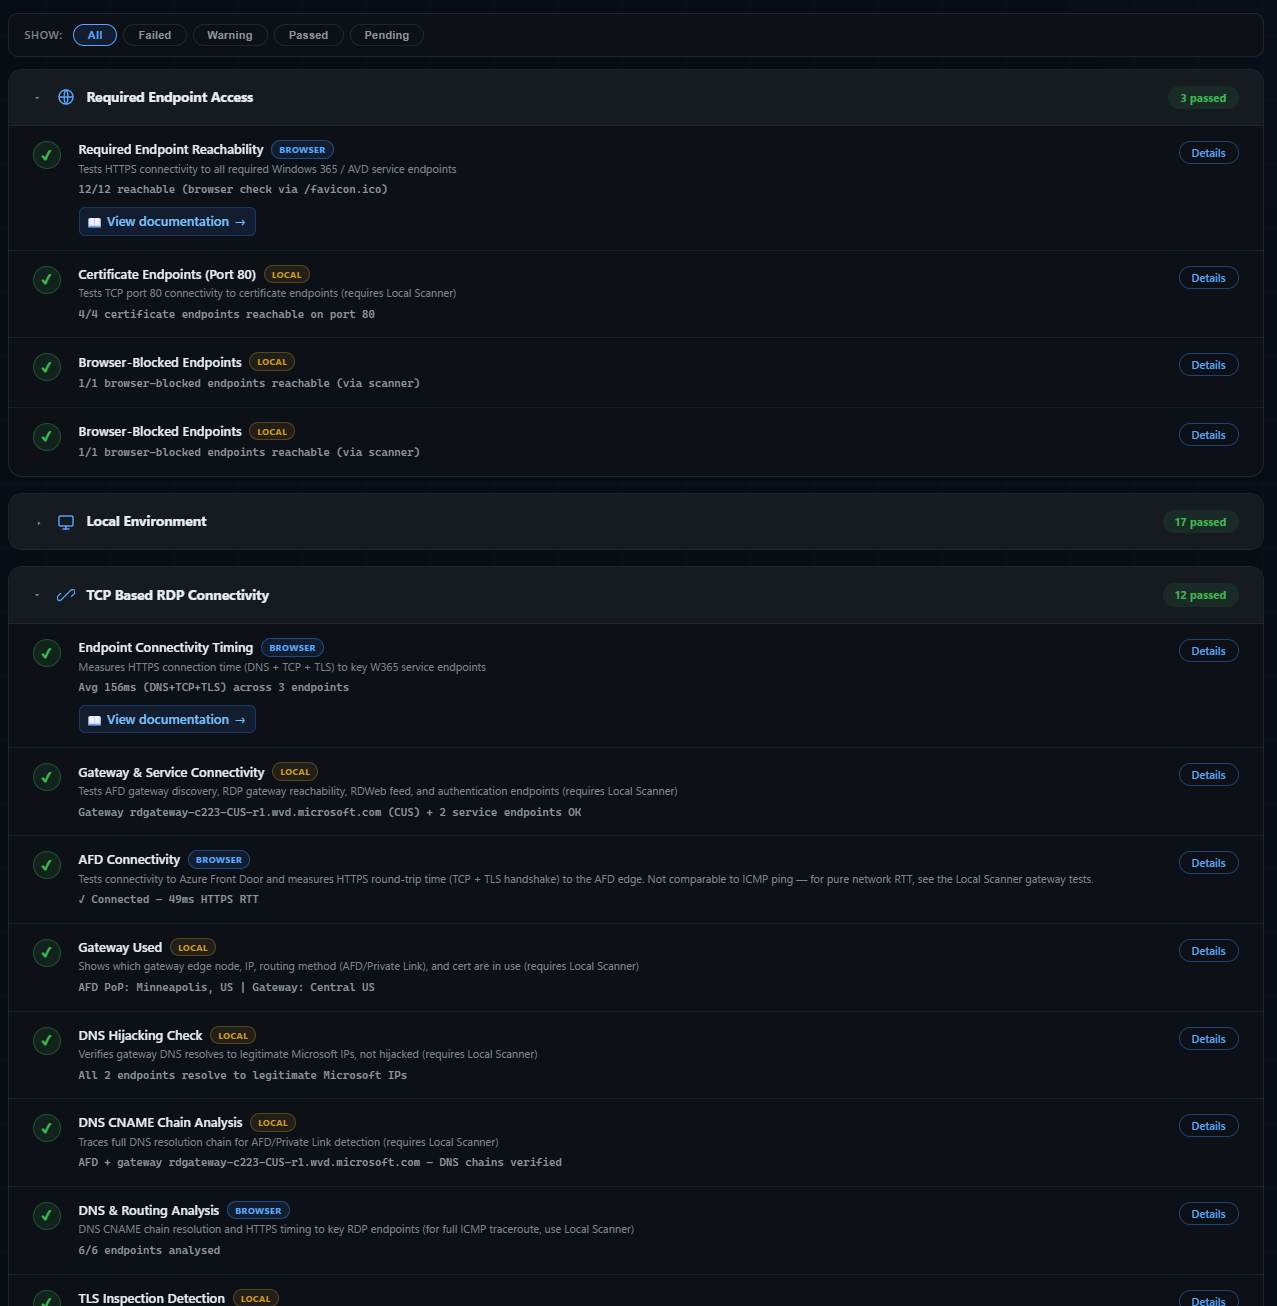
The dashboard provides a connectivity-path visualization, findings and suggested fixes, status filtering, and the ability to rerun failed checks. You can import a previous JSON scan for a before/after comparison, which is useful when validating a network change.
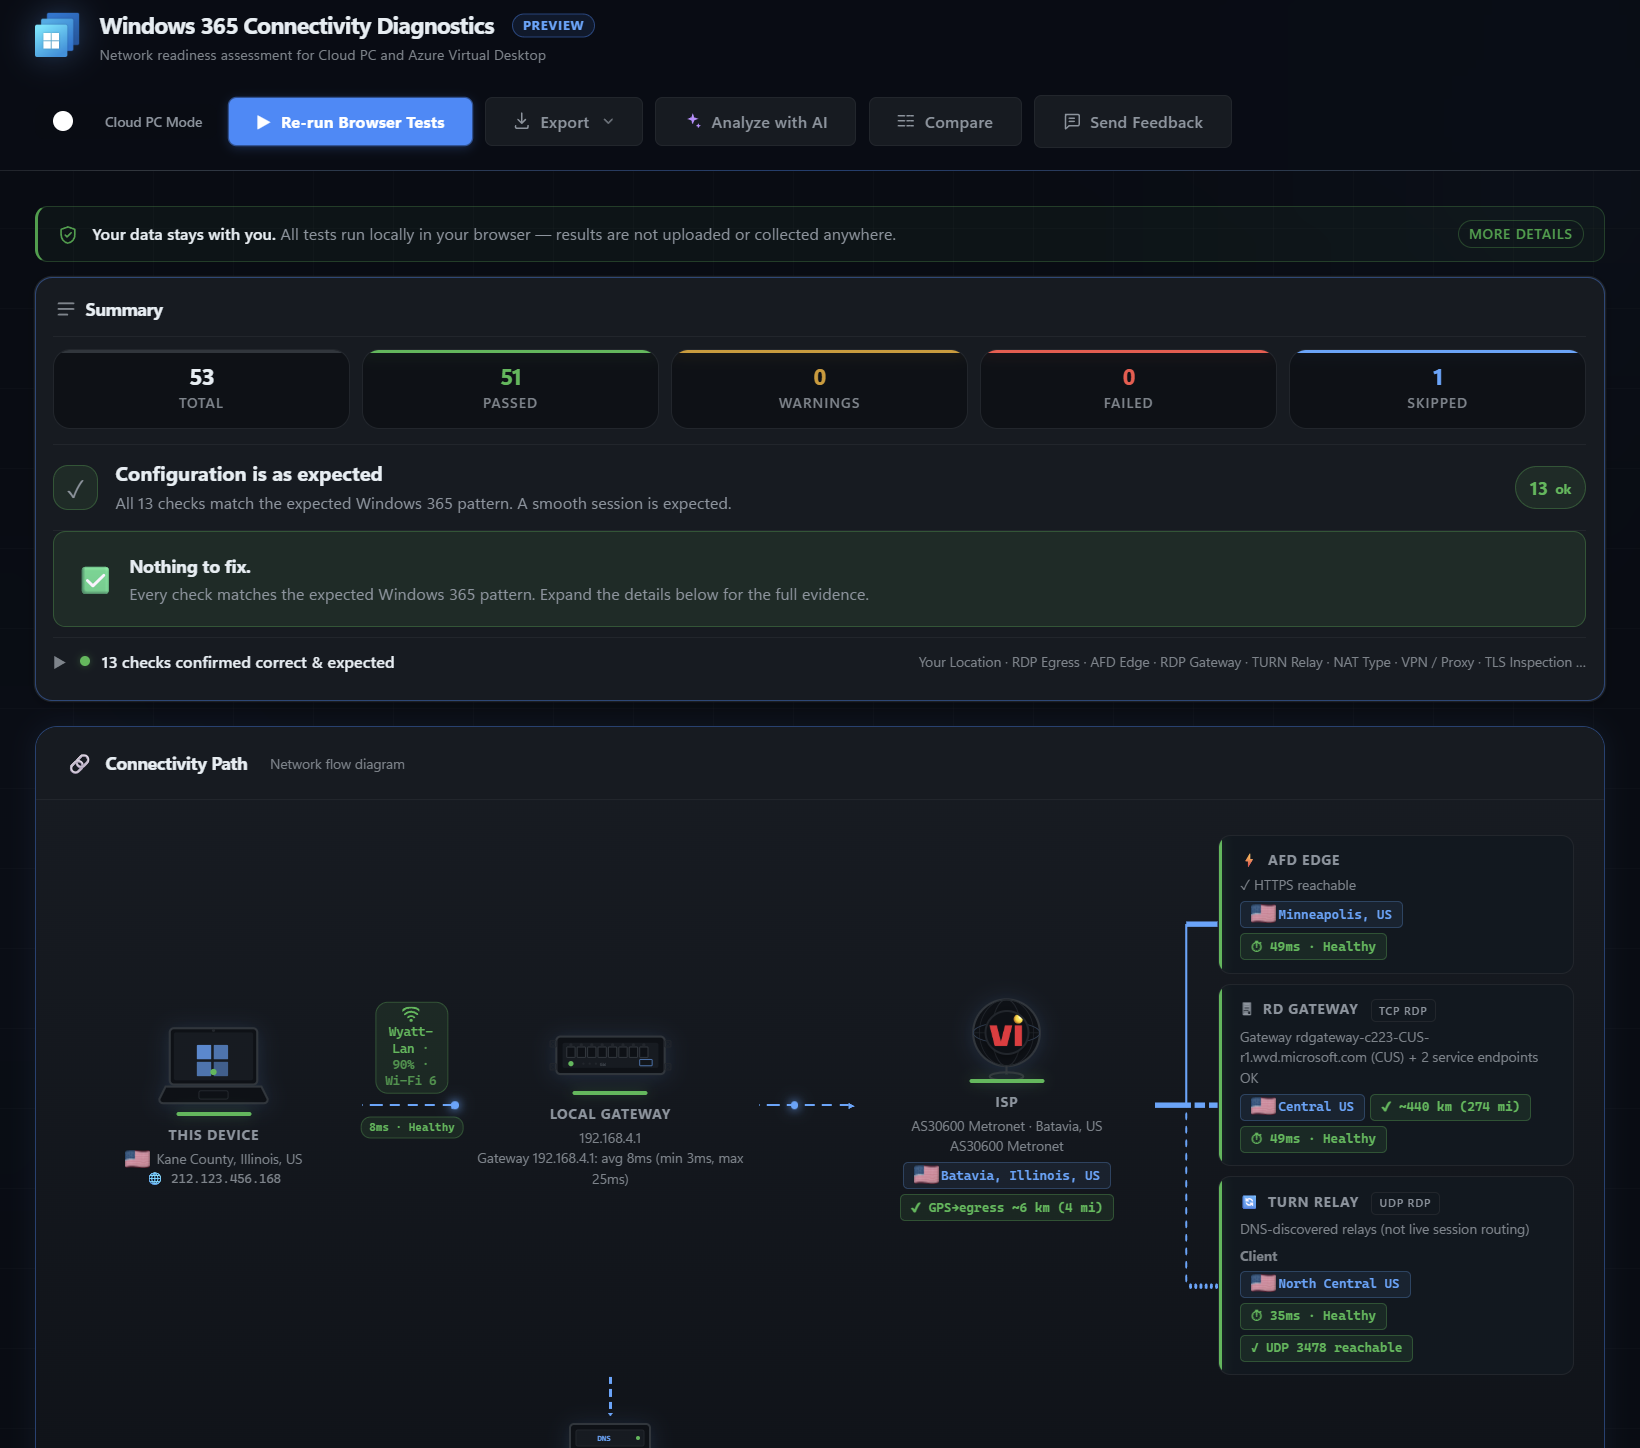
Results can be exported as Text, JSON, or CSV, prepared for Email to IT, or included in a share link. The dashboard also offers an optional Analyze with AI action for reviewing findings with Copilot.
I would start with a browser scan, add a local scanner capture, then collect a host-side scan if the cause is still unclear. For intermittent disconnects, Session Watch can add the timeline that a one-time result is missing.
What to Send to Support#
Before escalating, collect enough information for someone else to understand and investigate the issue:
- Symptom: What failed, and what was the user trying to do?
- Error: The exact message and error code, preferably with a screenshot.
- Time: The failure or reproduction timestamp, including the time zone.
- Scope: Whether one user, one Cloud PC, or multiple users are affected.
- Environment: Windows App or browser version, local operating system, and Cloud PC name or identifier.
- Results: Health check failures, connection metrics, inspection or Graph action results, and relevant connection history or monitoring events.
- Evidence: Client logs, downloaded reports, the Intune device diagnostic collection, and any Windows App advanced diagnostic package.
Conclusion#
Cloud PC connectivity troubleshooting starts with identifying where the connection is failing. Compare the web client with Windows App, review endpoint reachability, and collect evidence while the issue is occurring.
Windows App health checks show what is happening on the local device. Intune connectivity checks, connection quality reports, monitoring, and device diagnostics add the Cloud PC and service perspective. Graph provides another way to initiate connection troubleshooting when an administrative workflow calls for it.
If the issue persists, provide support with the exact error, relevant timestamps, test results, and diagnostic files. A clear reproduction and a well-organized set of evidence are far more useful than a large collection of logs with no context.
Sources#
- Windows 365 network requirements
- Device and app actions in Windows App
- Run health checks in Windows App
- Collect logs from Windows App
- Windows 365 connectivity health checks and connection history
- Collect device diagnostics in Intune
- Cloud PC connection quality report
- Cloud PC monitoring overview (preview)
- Troubleshoot using Cloud PC monitoring (preview)
- Remotely manage Windows 365 devices
- Cloud PC actions report
- Microsoft Graph cloudPC: troubleshoot
- Troubleshoot Cloud PC connection errors
- Visual Studio Code REST Client
- Use RDP Multipath with Windows 365
- Optimization of RDP traffic
- Windows 365 Connectivity Diagnostics dashboard (preview)
- Windows 365 Connectivity Tool project and scanner documentation